


Guest post originally published on InfraCloud’s blog by Ninad Desai, InfraCloud
In the previous post, we covered monitoring basics, including Prometheus, metrics, its most common use cases, and how to query Prometheus data using PromQL. If you’re just starting with Prometheus, I’d highly recommend reading the first two parts of the ‘Prometheus Definitive Guide’ series. In this blog post, we will focus on how we can install and manage Prometheus on the Kubernetes cluster using the Prometheus Operator and Helm in an easy way. Let’s get started!
What is an operator?
Before moving directly to the installation of the Prometheus using the Prometheus Operator, let’s first understand some of the key concepts needed to understand the Prometheus Operator.
Custom Resource Definition (CRD) resource is a way to define your own resource kind like Deployment, StatefulSet etc. CRDs define the structure and validation of the custom kind.
Custom Resource (CR) are the resources that are created by following the structure from a Custom Resource Definition (CRD).
Custom Controller makes sure that our Kubernetes cluster or application always matches its current state with the desired state that we expect it to.
So, Operator is a set of Kubernetes custom controllers that we deploy in the cluster. These listen for changes in the custom resources owned by them (those which we have created using CRDs), and perform certain actions like creating, modifying, deleting Kubernetes resources.
You can read more about this in the Custom Resources documentation page.
What are some use cases of Kubernetes operators?
A Kubernetes operator can:
- Provide a great way to deploy stateful services like any database on Kubernetes
- Handling upgrades of your application code
- Horizontal scaling of resources according to performance metrics
- Backup and restoration of your application state or databases on demand
- Deploy any monitoring, storage, vault solutions to Kubernetes
What is Prometheus Operator?
In simple words, Prometheus Operator is a fully automated way of deploying (like any other standard Kubernetes Deployment object) Prometheus server, Alertmanager and all the related secrets, configmap etc; that will help to set up Prometheus monitoring ecosystem and instantiate Kubernetes cluster monitoring in just a few minutes.
Once deployed, Prometheus Operator provides the following features:
Automation: Easily launch a Prometheus instance for your Kubernetes namespace, a specific application, or a team.
Service discovery: Automatically discover the targets to be monitored using familiar Kubernetes label queries; without a need to learn a Prometheus specific configuration language.
Easy Configuration: Manage the configuration of the essential resources of Prometheus like versions, persistence, retention policies, and replicas from a Kubernetes resource.
Ways to install Prometheus stack
There are three different ways to setup the Prometheus monitoring stack in Kubernetes.
1.Creating everything on your own
If you’re completely comfortable with Prometheus components and its every prerequisites, you can then manually deploy YAML spec file for every component like Prometheus, Alertmanager and Grafana, all the Secrets and ConfigMaps used by Prometheus stack in right sequence by considering its inter dependency.
This approach can be quite time consuming and take a lot of effort to deploy and manage the Prometheus ecosystem. Also it would need a strong documentation to be built to replicate it for any other environments
2.Using Prometheus Operator
We have conceptually already seen the way the Prometheus Operator can ease our life by managing the life cycle of all the Prometheus components single-handedly.
We can find the Prometheus Operator here, that we can use to deploy Prometheus inside your Kubernetes cluster.
3.Using Helm chart to deploy operator
This approach is the most efficient and better option where we can use the Helm chart maintained by the Prometheus community to deploy Prometheus Operator. So, in a nutshell, Helm will do initial Prometheus Operator installation along with creation of Prometheus, Alertmanager, and other custom resources. And then the Prometheus Operator will manage the entire life-cycle of those custom resources. It’s very easy and straightforward to install by just executing the following steps:
helm repo add prometheus-community https://prometheus-community.github.io/helm-charts

helm repo update

helm install prometheus prometheus-community/kube-prometheus-stack
This kube-prometheus-stack chart installs the following components:
- Prometheus Operator
- Prometheus and Alertmanager (creates the
Prometheus,Alertmanagerand related CRs) - Grafana
- node-exporter, and a couple of other exporters
They are also pre-configured to work together and set up basic cluster monitoring for you while also making it easy to tweak and add your own customization.
The execution of the above commands will be quite quick and it will take a few more minutes to bring all the components up and running.
You can run helm get manifest prometheus | kubectl get -f - command to see all the objects created as below:
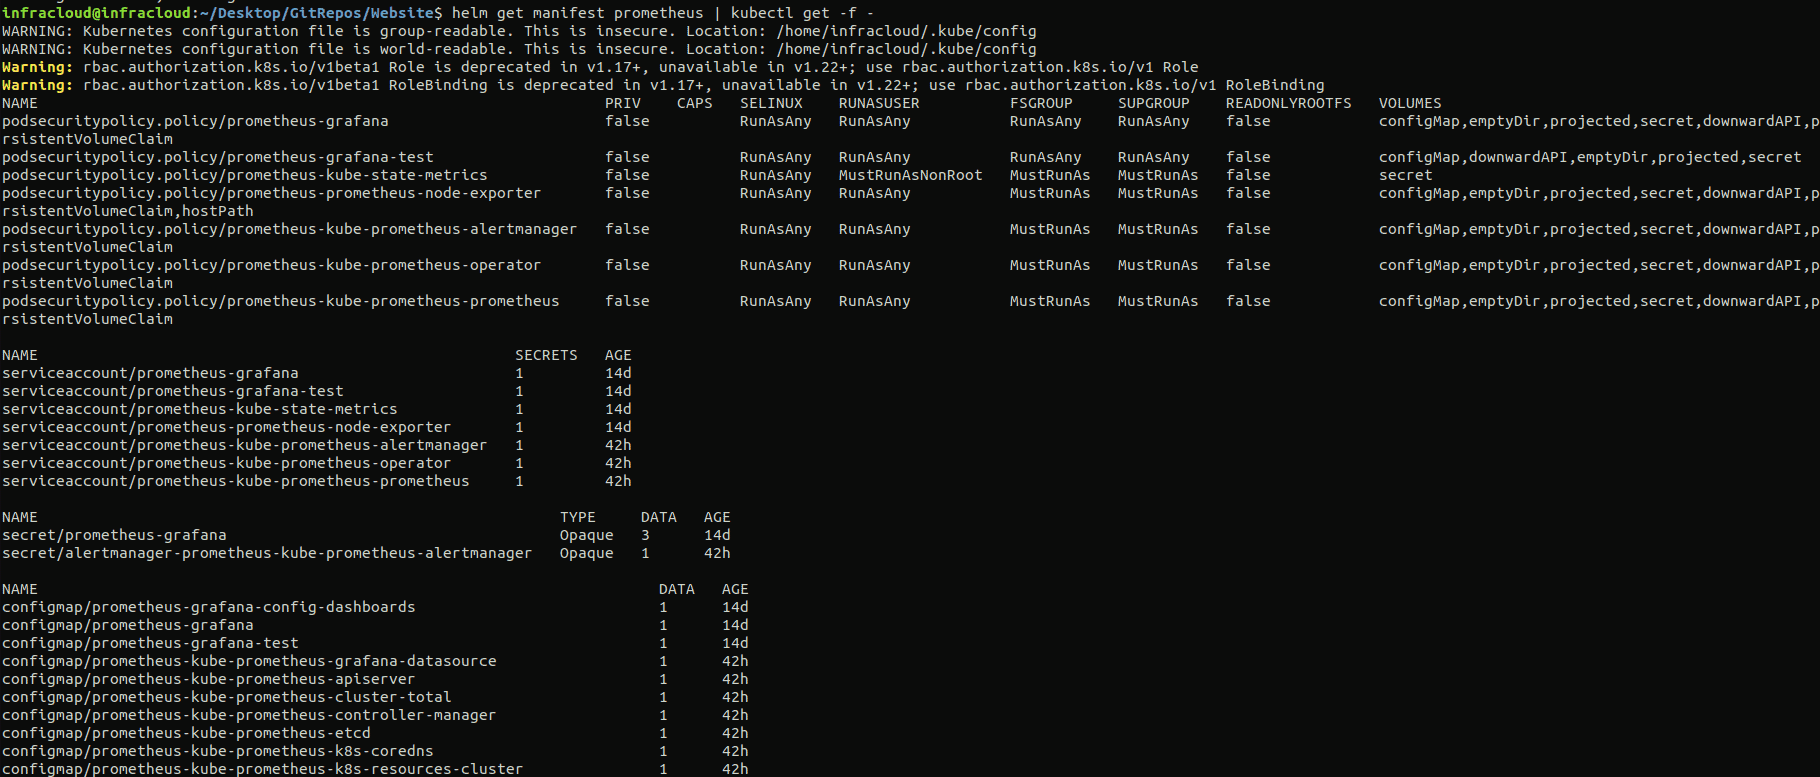
You would be able to see all the different resources like the Deployments, StatefulSets of the Prometheus stack being created as shown above.
How does Prometheus find all the targets to monitor and scrape?
For Prometheus to figure out what all it needs to monitor, we need to pass a YAML configuration file, usually called prometheus.yaml; that Prometheus can refer to and start monitoring accordingly. Each target endpoint to be monitored is defined under the scrape_configs section in the prometheus.yaml. A typical sample configuration file that comes with Prometheus release tar has the following content:
# my global config
global:
  scrape_interval:     15s # Set the scrape interval to every 15 seconds. Default is every 1 minute.
  evaluation_interval: 15s # Evaluate rules every 15 seconds. The default is every 1 minute.
  # scrape_timeout is set to the global default (10s).

# Alertmanager configuration
alerting:
  alertmanagers:
  - static_configs:
    - targets:
       - localhost:9093

# Load rules once and periodically evaluate them according to the global 'evaluation_interval'.
rule_files:
  - '/etc/prometheus/alert.rules'

  # - "first_rules.yml"
  # - "second_rules.yml"

# A scrape configuration containing exactly one endpoint to scrape:
# Here it's Prometheus itself.
scrape_configs:
  # The job name is added as a label `job=<job_name>` to any timeseries scraped from this config.
  - job_name: 'prometheus'

    # metrics_path defaults to '/metrics'
    # scheme defaults to 'http'.

    static_configs:
      - targets: ['localhost:9090']

  - job_name: 'node_exporter'
    scrape_interval: 5s
    static_configs:
      - targets: ['localhost:9100']
So, let’s dive deep into some of the major key terms from the prometheus.yaml file.
There are two ways to specify a set of target endpoints to be scraped by Prometheus:
- Using
scrape_config - Using ServiceMonitors (Prometheus Operator specific)
scrape_config vs ServiceMonitor: When to use one over the other?
A scrape_config specifies a set of targets and configuration parameters describing how to scrape them. In this case, for each target; one scrape configuration block needs to be defined as you see in the above sample prometheus.yaml file.
A ServiceMonitor lets us create a job entry in scrape_config in an easier Kubernetes-native way. Internally Prometheus Operator translates the configuration from each ServiceMonitor resource to prometheus.yaml’s scrape_config section. The Prometheus resource created by the kube-prometheus-stack has a selector which says, act on all the ServiceMonitors with label release: prometheus (configuration). Take a look at the diagram below of how it works:
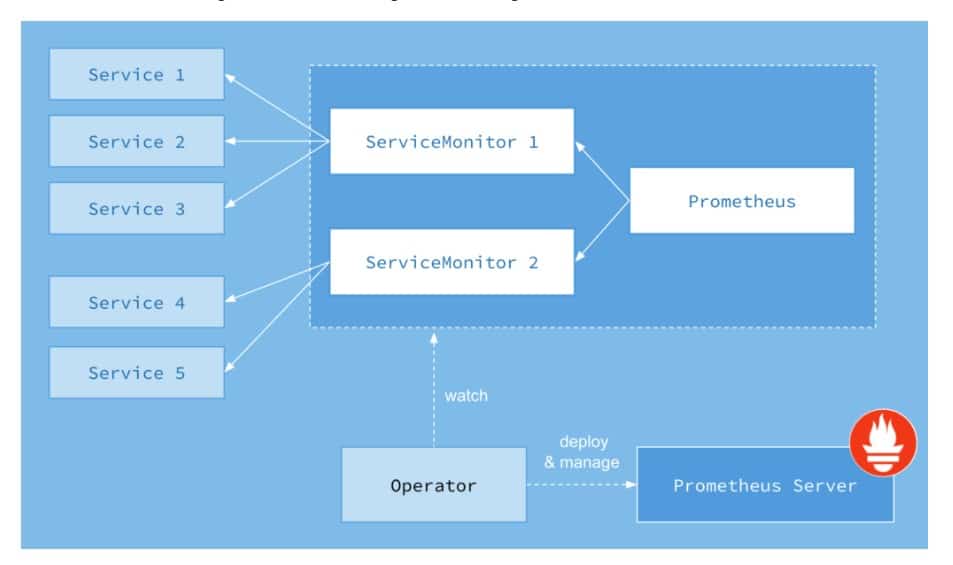
Image Credits: CoreOS
Let’s check if a ServiceMonitor automatically creates a scrape_config entry in the Prometheus config file or not by taking Prometheus service itself as an example.
kubectl get services prometheus-prometheus-oper-prometheus -o wide --show-labels
NAME                                    TYPE        CLUSTER-IP      EXTERNAL-IP   PORT(S)    AGE   SELECTOR                                                          LABELS
prometheus-prometheus-oper-prometheus   ClusterIP   10.105.67.172   <none>        9090/TCP   12d   app=prometheus,prometheus=prometheus-prometheus-oper-prometheus   app=prometheus-operator-prometheus,release=prometheus,self-monitor=true
Let’s take a look if the respective ServiceMonitor is in place for Prometheus’ service or not.
kubectl get servicemonitors.monitoring.coreos.com -l app=prometheus-operator-prometheus
NAME                                    AGE
prometheus-prometheus-oper-prometheus   12d
This confirms that the ServiceMonitor for the Prometheus service itself is present. Let’s now try to see if this ServiceMonitor “prometheus-prometheus-oper-prometheus” has added a job inside the Prometheus config YAML file.
To check this, we first need to access the Prometheus pod created by the Prometheus Operator.
kubectl exec -it prometheus-prometheus-prometheus-oper-prometheus-0 -- /bin/sh
/prometheus $
Once we are inside the pod, let’s find out the configuration file name used by Prometheus inside the pod now.
/prometheus $ ps

PID   USER     TIME  COMMAND
1     1000      4h58 /bin/prometheus … --config.file=/etc/prometheus/config_out/prometheus.env.yaml
59    1000      0:00 /bin/sh
We could see above, the config file with name prometheus.env.yaml is created by the operator and used by the Prometheus server to find out target endpoints to be monitored and scraped. Finally, let’s try to find out if the job for the Prometheus service itself is added by ServiceMonitor or not inside this configuration file:
/prometheus $ cat /etc/prometheus/config_out/prometheus.env.yaml | grep -i -A 10 "job_name: default/prometheus-prometheus-oper-prometheus/0"
- job_name: default/prometheus-prometheus-oper-prometheus/0
  honor_labels: false
  kubernetes_sd_configs:
  - role: endpoints
    namespaces:
      names:
      - default
  metrics_path: /metrics
We could see the job for Prometheus service. So, this shows that a ServiceMonitor automatically creates job for the Kubernetes-based service to be monitored and scraped.
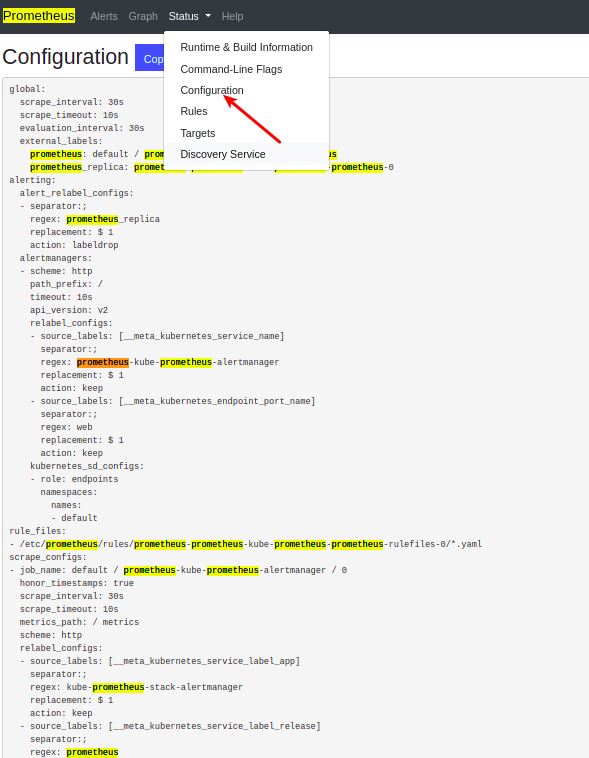
There is also another way to view the scrape_config directly inside the Prometheus web UI at Status -> Configuration as you can see below:
Apart from ServiceMonitor, there is another way called PodMonitor to scrape your Kubernetes pods. This is also a custom resource handled by Prometheus Operator.
What is a PodMonitor, when is it needed?
PodMonitor declaratively specifies how to directly monitor a group of pods.
PodMonitor vs ServiceMonitor
One must be wondering that when we have ServiceMonitor in place, then what is the need to have PodMonitor which ultimately do the same job as ServiceMonitor.
The way I see it, ServiceMonitor is suitable if you already have a Service for your pods. However, if in a certain scenario, you don’t have it, then PodMonitor is the right choice.
Discovering targets to scrape
To scrape target endpoints, first Prometheus should know what those are and how to monitor those targets. So, there are mainly two ways in Prometheus configuration to define the target endpoints to be monitored.
Using static_config mechanism
If you have a very small and fixed set of Kubernetes services/endpoints to be monitored, then you can define those static endpoints using static_config in the prometheus.yml file.
Take a look at this example that shows how we can configure Prometheus to use static_configs to monitor Prometheus itself by default.
This is fine for simple use cases, but practically having to manually keep your prometheus.yml up to date as machines are added and removed would get annoying, particularly if you were in a dynamic environment like Kubernetes where new instances of application services might be brought up every minute.
Using service_discovery mechanism
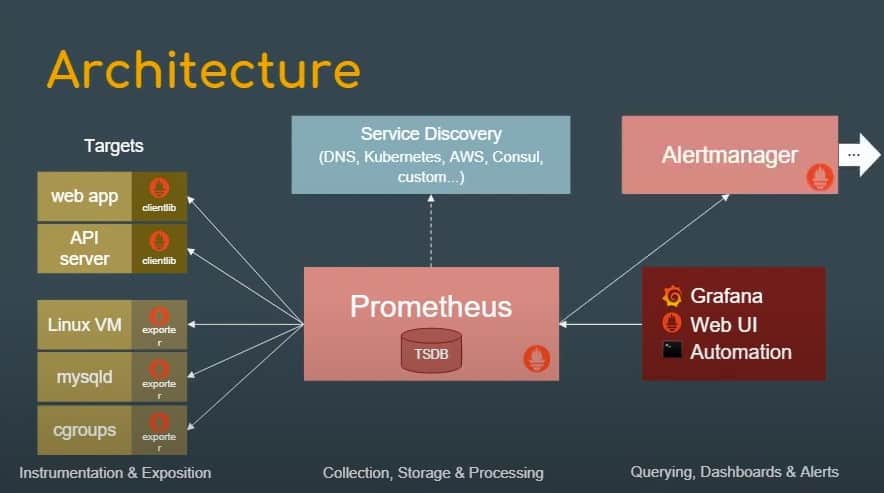
There are different Prometheus supported service-discovery mechanisms like DNS, Kubernetes, AWS, Consul, custom one, etc. These mechanisms dynamically discover target endpoints to be monitored and scraped. In the case of Kubernetes, it uses the Kubernetes API to discover a list of target endpoints to monitor and scrape.
Take a look at this example that shows how we can configure Prometheus for Kubernetes.
Prometheus Operator takes care of configuring above based on the ServiceMonitor and PodMonitor resources.
Rules in Prometheus
Prometheus supports two types of rules which can be configured and evaluated at regular intervals. These are mainly:
- Recording rules
- Alerting rules
You can create a YAML file containing your rule statements and load them into Prometheus using the rule_files field in Prometheus configuration.
When using Prometheus Operator, these rules can be created with the helm of PrometheusRule resource.
Recording rules
Recording rules allow you to pre-compute PromQL expressions which are frequently used and internally require a relatively large number of steps to complete the result of that expression. Next time, when you run the same PromQL query, results will be fetched from pre-computed PromQL results. These are faster than originally executing the same query again and again.
For example:
groups:
  - name: example
    rules:
    - record: job:http_inprogress_requests:sum
      expr: sum by (job) (http_inprogress_requests)
Alerting rules
Alerting rules allow you to define alert conditions based on PromQL and to send notifications about firing alerts to an external receiver. Whenever the alert expression results in True at any point of time, it sends alerts.
For example:
groups:
- name: example
  rules:
  - alert: HighRequestLatency
    expr: job:request_latency_seconds:mean5m{job="myjob"} > 0.5
    for: 10m
    labels:
      severity: page
    annotations:
      summary: High request latency
Alerts and visualization
Credit: Prometheus introduction
Once the Alerting rules are configured, we would like to send alerts to external receivers. We would need someone who can add alert summary, control, and sometimes silence the number of notifications that the receiver will receive. This is where Alertmanager comes into the picture.
Alertmanager Insights
As you can see in the above diagram, Alertmanager periodically receives information about alert state from Prometheus server and then it makes sure to group, deduplicate and send notifications to the defined receiver like email, PagerDuty, etc.
But where and how to define or set up Alertmanager in the Kubernetes cluster? Well, we don’t need to worry about it as the Prometheus Operator we had deployed with help of Helm chart earlier, creates an Alertmanager as a StatefulSet as you could see:
kubectl get statefulsets.apps

NAME                                                    READY      AGE
alertmanager-prometheus-prometheus-oper-alertmanager    1/1         8d
This Alertmanager StatefulSet internally uses a configuration file called alertmanager.yaml as you could see below (inside alertmanager pod) :
/bin/alertmanager --config.file=/etc/alertmanager/config/alertmanager.yaml
In this alertmanager.yaml file (as you could see below), some of the key things like route and receiver are defined.
Here,
route: It’s a code block that defines where the alerts will be further routed to.
receiver: Receiver is the one to whom alerts will be sent or notified finally. It can be a webhook or an email address or a tool like PagerDuty.
inhibit_rules: The inhibit rules section allows to silence a set of alerts given that another alert is firing for the same cause. For example, normally if any application service goes down then warning-level notification will be silenced as that service has gone into critical mode already.
You can take a look at the sample Alertmanager configuration file.
global:
  resolve_timeout: 5m

route:
  group_by: ['alertname']
  group_wait: 10s
  group_interval: 10s
  repeat_interval: 1h
  receiver: 'web.hook'
receivers:
- name: 'web.hook'
  webhook_configs:
  - url: 'http://127.0.0.1:5001/'
inhibit_rules:
  - source_match:
      severity: 'critical'
    target_match:
      severity: 'warning'
    equal: ['alertname', 'dev', 'instance']
Metrics visualization with Grafana
Okay, now enough of all the insights and let’s access Grafana straight away, which is a standard tool that helps you to visualize all the metrics you have gathered with help of Prometheus.
Our kube-prometheus-stack Helm chart has already deployed Grafana for us. Now, to access Grafana dashboard, we first need to find the Grafana service.
kubectl get services


NAME                               TYPE        CLUSTER-IP       EXTERNAL-IP   PORT(S)

prometheus-grafana                ClusterIP    10.104.143.147    <none>       80/TCP
Let’s port-forward to this service so that we can access the Grafana web interface.
kubectl port-forward svc/prometheus-grafana 3000:80

Forwarding from 127.0.0.1:3000 -> 3000
Forwarding from [::1]:3000 -> 3000
And then in the browser visit <http://localhost:3000>
If you’re able to see the Grafana dashboard below, Congratulations!!!
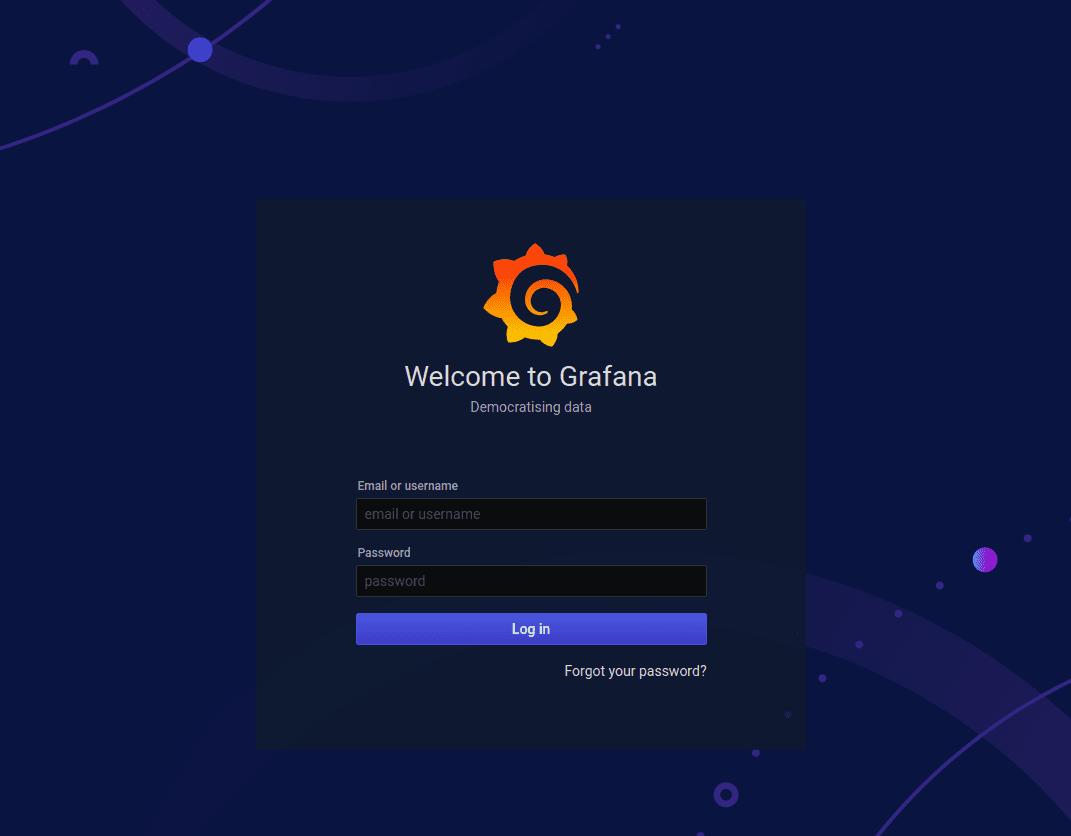
Enter the default username: admin and password: prom-operator which you can find in this prometheus-operator Github repo to access Grafana.
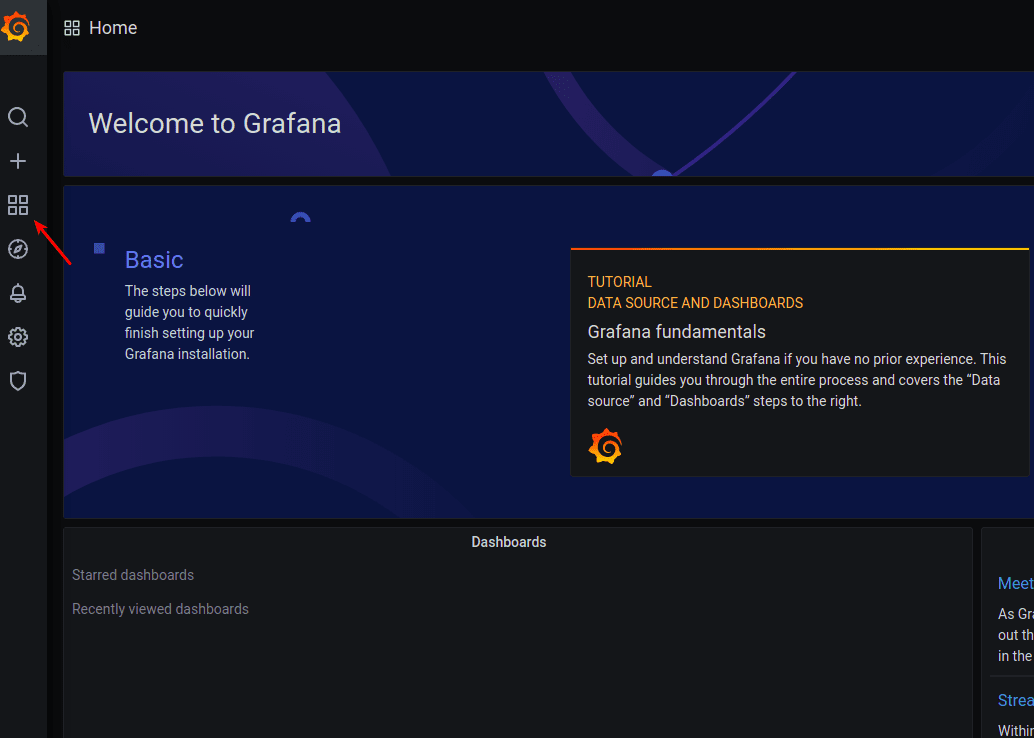
After adding these credentials, you would be able to logged-in to Grafana as below:
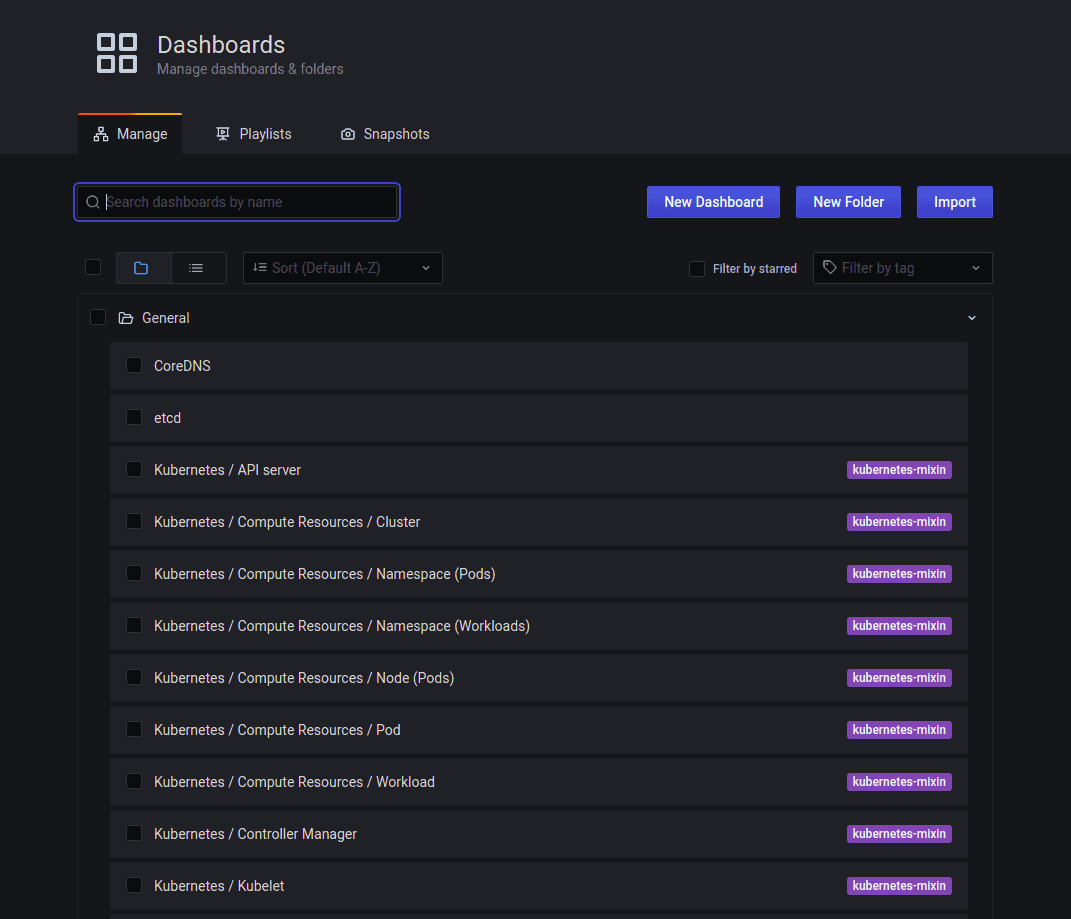
Click on Dashboard -> Manage, and you would be able to see all the dashboards provided by kube-prometheus-stack about our Kubernetes cluster:
And you can browse through any of those dashboards. For example, ‘Kubernetes/Compute Resources/Pod’ dashboard as below:
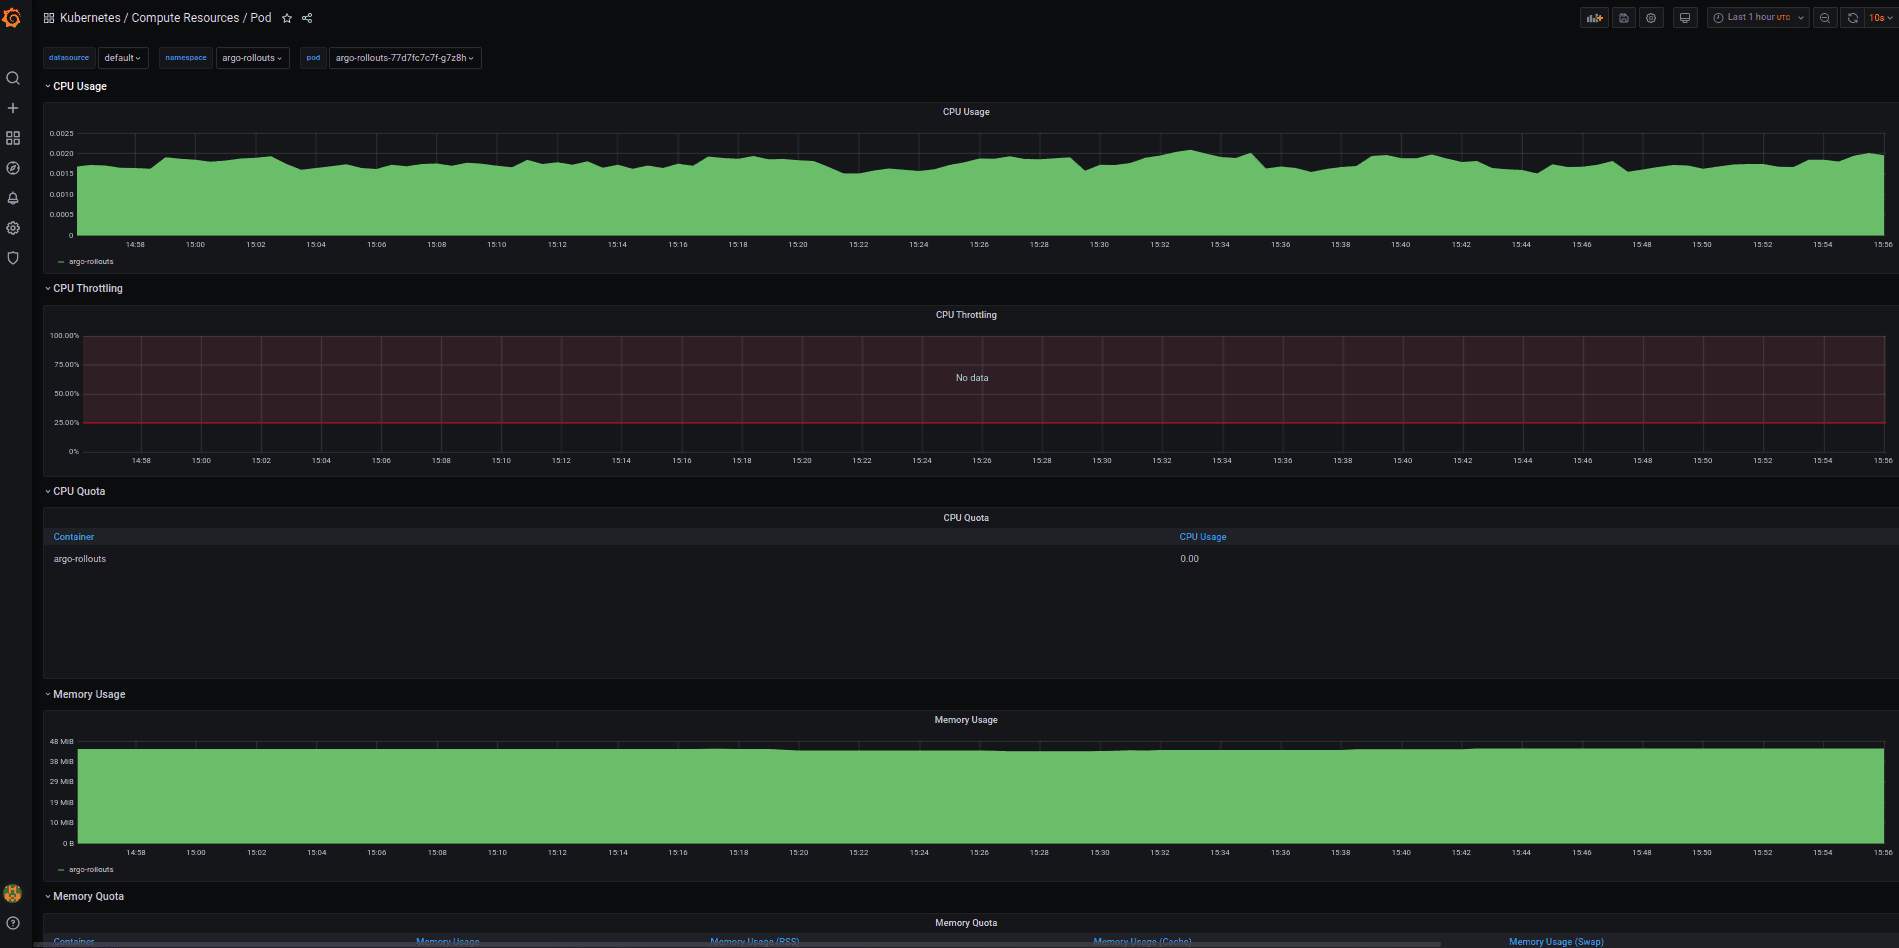
These all standard dashboards are basically generated from the kubernetes-mixin project.
Summary
Let’s do a quick recap before concluding this post. We discussed what the Prometheus Operator is and how we can configure Prometheus easily with help of the Prometheus Operator and Helm charts. We also explored how Prometheus discovers the resources to monitor and what all components of Prometheus one needs to configure and how they work. Plus, we also looked at how we can set up alerts as well as how to visualize them.
I hope you found this post informative and engaging. For more posts like this one, do subscribe to our weekly newsletter. I’d love to hear your thoughts on this post, so do start a conversation on Twitter or LinkedIn :).