
Guest post originally published on New Relic’s blog by Jack Berg, engineer at New Relic
This blog post is part of the Understand OpenTelemetry series.
Part 1 gave an overview to OpenTelemetry and discussed why it is the future of instrumentation.
Part 2 explored the core components of the OpenTelemetry open source project.
Part 3 focused on the primary OpenTelemetry data sources: traces, metrics, and logs.
Now that you have a good understanding of OpenTelemetry and the core concepts, you can get to work! In Part 4, you can explore working sample Java applications instrumented with OpenTelemetry.
OpenTelemetry Java is a language-specific implementation of OpenTelemetry in Java. Like all languages, it has an application programming interface (API) and a software development kit (SDK), which you can see in the opentelemetry-java project. Library and application authors use the API to instrument code. The SDK defines the implementation of the API. Applications configure it to describe how to process and export the generated instrumentation data.
Additionally, OpenTelemetry has a Java agent (opentelemetry-java-instrumentation), which is analogous to the New Relic Java Agent. When attached to an application, it modifies the bytecode of a variety of popular libraries and frameworks to capture telemetry data. This more automatic instrumentation, often referred to as an “auto-instrumentation” option, is popular because with just a little configuration you can get a lot of useful information about your applications. In situations where the auto-instrumentation is lacking or doesn’t suit your needs, you can use the OpenTelemetry APIs to manually add custom instrumentation.
In this blog post, we’ll walk through how to manually instrument an application with the OpenTelemetry Java project (configuring APIs and the SDK), and how to use auto-instrumentation with the Java agent. We’ll be referencing source code from examples in the newrelic-opentelemetry-examples GitHub repository, which includes a variety of examples related to OpenTelemetry and New Relic.
OpenTelemetry examples video
The following video walks through examples from a simple application with some customization added with the OpenTelemetry Java API and SDK:
Get started today
- Review the OpenTelemetry quick start guide.
- Check out New Relic’s OpenTelemetry examples.
- Sign up for New Relic’s native OTLP ingest endpoint.
Manual instrumentation
The sdk-nr-config example demonstrates manual instrumentation for OpenTelemetry Java through the OpenTelemetry API and configuration through the OpenTelemetry SDK. Gradle is used for builds, and because there are multiple examples that share code in the project, it’s a multi-project build. For a complete picture, take a close look at the build.gradle file in the :sdk-nr-config module and in the root module.
The build.gradle file in the root module takes a platform dependency on the OpenTelemetry bill of materials (BOM) for all subprojects. The BOM provides a convenient way to keep versions of OpenTelemetry components in sync, allowing you to omit the version of specific dependencies.
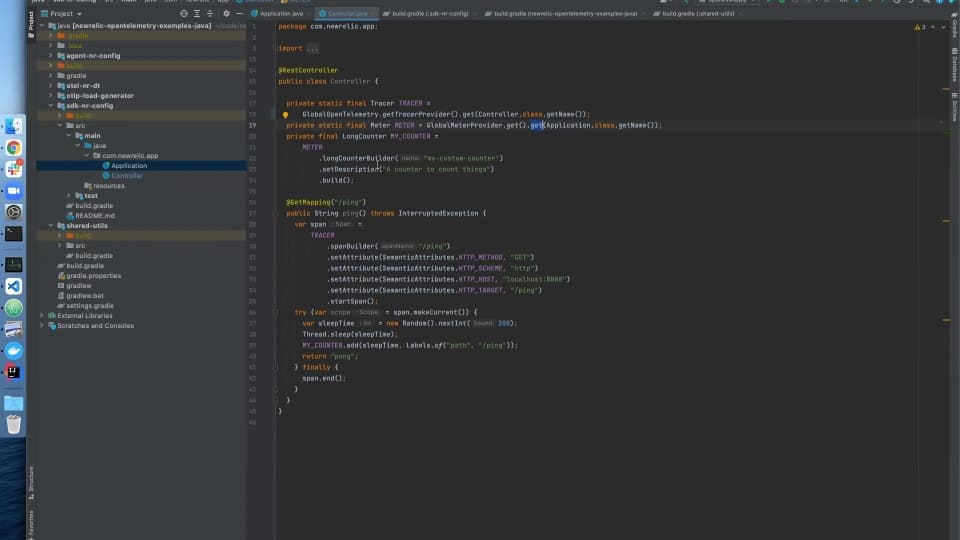
Tracing API
Set up custom tracing by establishing a tracer for the library that you are instrumenting. From a tracer, you can build spans, and set the span context. Setting the span context ensures that subsequent spans set up on the code path have a proper parent-child relationship.
Be sure to take a look at the Trace Semantic Conventions and ensure that custom tracing instrumentation follows the established conventions of applicable operations. The semantic conventions allow observability platforms like New Relic to interpret the data in a more meaningful way and provide a better experience.
See the OpenTelemetry Java Tracing documentation for explanations of concepts and more examples.
Metrics API
Set up custom metrics by establishing a meter for the library being instrumented. From a meter, you can create instruments. Use instruments to record data, and optionally associate attributes describing key dimensions of the context in which the data is recorded.
Like traces, there’s a set of Metric Semantic Conventions describing how to add metrics instrumentation for common operations. Be sure to follow these where applicable.
See the OpenTelemetry Java Metrics documentation for explanations of concepts and more examples. OpenTelemetry Metrics is still a work in progress, so the details of this example will change in the coming months.
The following video walks through setting up the OpenTelemetry tracer and meter:
Configuring the OpenTelemetry SDK
By default, the OpenTelemetry API returns no-op implementations of the classes, meaning that all of the data recorded is simply dropped. Configuring the OpenTelemetry SDK enables the data to be processed and exported in useful ways.
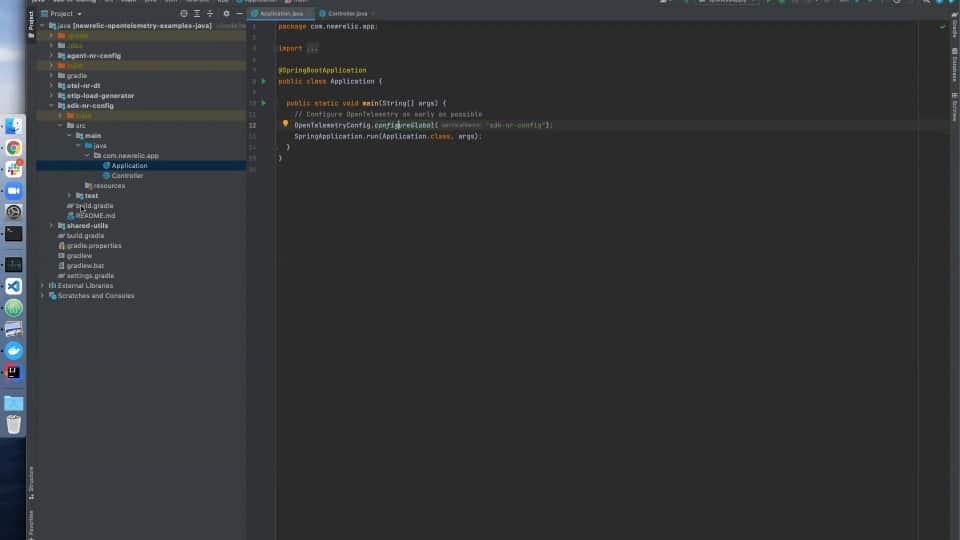
Note that the OpenTelemetry APIs expose static methods for initializing tracing and metrics instrumentation. Because of this, you’ll want to configure the SDK as early as possible in the application lifecycle. Otherwise, you risk initializing instrumentation before the SDK implementation is set up.
See the OpenTelemetry Java SDK Configuration documentation for more information.
The following video explains why you need to configure the Java SDK before sending data and walks through how to do it:
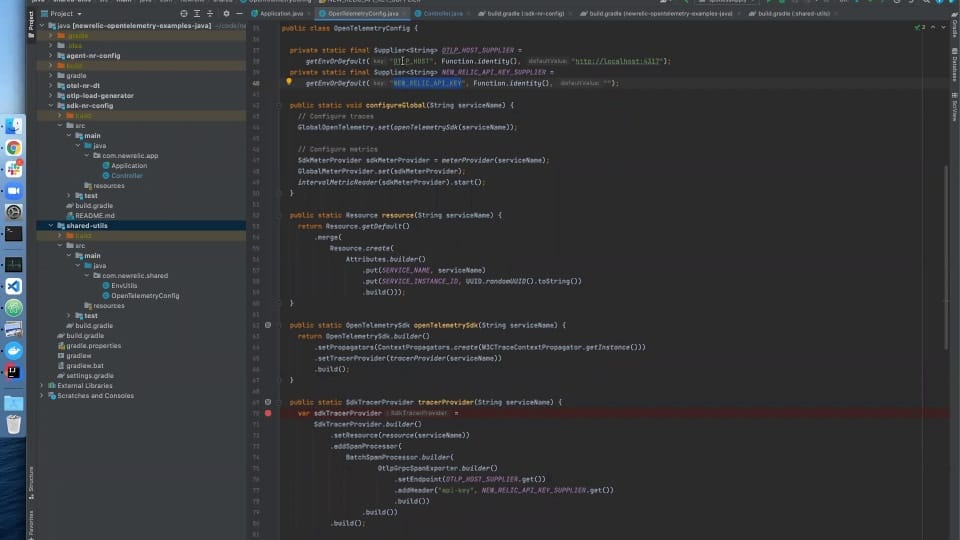
Trace configuration
When configuring the OpenTelemetry SDK for tracing, consider the following information:
- The resource defines the software entity the trace data is associated with.
- Span limits are available to impose limits on the data associated with a span, including the max number of attributes, events, and links.
- Context propagation describes how trace state is propagated across application boundaries for distributed traces.
- Sampling determines how to decide which traces to capture when it’s not practical to trace everything.
- Span processors provide a means of hooking into spans starting and ending and performing arbitrary logic.
- Exporting defines how trace data is exported out of the application.
Metric configuration
When configuring the OpenTelemetry SDK for metrics, consider the following information:
- The resource defines the software entity the metric data is associated with.
- Views allow you to customize how metric data is aggregated, including the aggregation type (summary, counter, histogram), the aggregation temporality (cumulative or delta), and the attributes retained.
- Exporting defines how metric data is exported out of the application.
Because OpenTelemetry Metrics is still a work in progress, the details of metrics SDK configuration will change in the coming months.
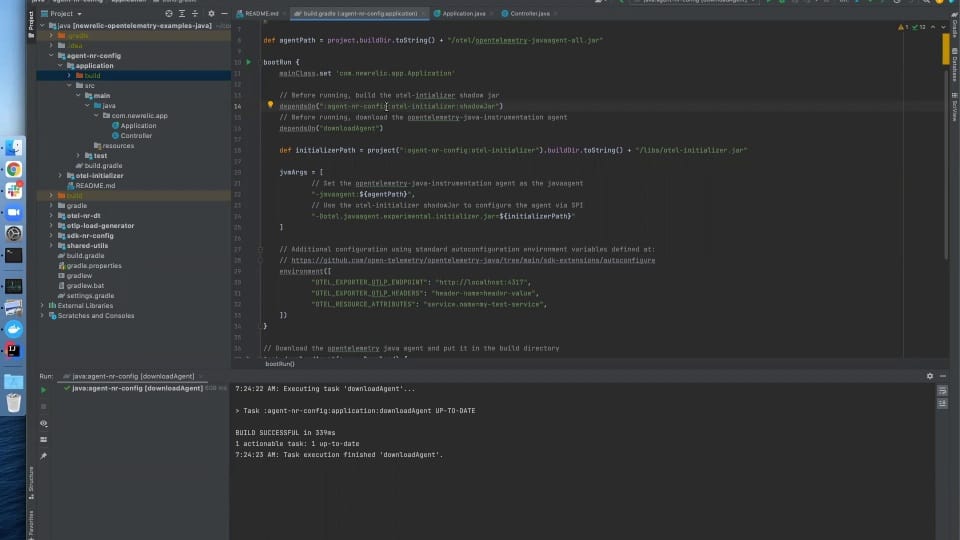
Auto-instrumentation
The agent-nr-config example demonstrates automatic instrumentation through the OpenTelemetry Java Agent. See the list of supported libraries and frameworks at Libraries / Frameworks.
To use the agent, you generally use the following workflow:
- Download the agent JAR file.
- Set up environment variables or system properties to configure how the agent uses the OpenTelemetry SDK.
- Run the application, referencing the path to the agent jar in the
-javaagentJVM arg.
The example project performs these steps through tasks defined in the Gradle build. You’ll need to adapt them to accommodate the build and environment of your application.
The following video shows how to run OpenTelemetry with a Java agent:
Now that you have mastered how to instrument your Java application using both manual and auto-instrumentation, watch for our next blog, where you will learn how to set up a collector locally and send data to a backend platform for visualization and analysis.
Next Steps
- Review the OpenTelemetry quick start guide.
- Check out New Relic’s OpenTelemetry examples.
- Sign up for New Relic’s free tier.
- Sign up for New Relic’s native OTLP ingest endpoint.
- Check out Part 5 in the series to send the OpenTelemetry data to your backend platform.