
Guest post originally published on New Relic’s blog by Alan West and Lavanya Chockalingam
This blog post is part of the Understand OpenTelemetry series. Part 1 gave an overview to OpenTelemetry and discussed why it is the future of instrumentation. Now in Part 2, we explore the core components of the OpenTelemetry open source project.
The OpenTelemetry project consists of application programming interfaces (APIs), software development kits (SDKs), tools, specifications of a data model for telemetry data (metrics, logs, and traces), and semantic conventions for the data. It also defines a centralized collector and exporters to send telemetry data to various backends platforms, so you can gain visibility into performance in the observability platform that you choose. To understand how all these components work together, let’s look at an architecture diagram and then examine each of the components in more detail:
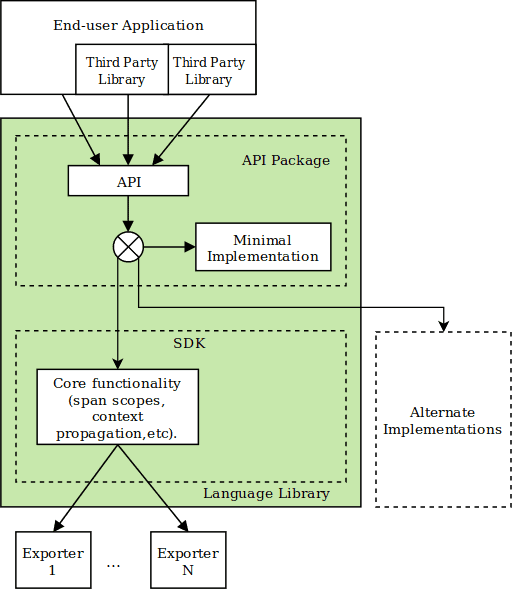
Source: OpenTelemetry Client Design Principles
OpenTelemetry architecture 101
This video tour walks through the OpenTelemetry concepts and components including the API, the SDK, the OpenTelemetry Protocol, and semantic conventions that enable you to work with various programming languages. You can read the sections below for a summary of each. It all starts with how the OpenTelemetery API is decoupled from the implementation in the SDK, allowing you to consume the OpenTelemetry API even without adopting OpenTelemetery in your stack.
OpenTelemetry API
The OpenTelemetry API is used by application developers and library authors to instrument their code to generate telemetry data: traces, metrics, and logs. OpenTelemetry has an implementation of the API for each of the popular programming languages and is completely decoupled from the implementation (the SDK). The API has minimal implementation, which means you can consume the OpenTelemetry API without needing to adopt OpenTelemetery in your stack.
OpenTelemetry SDK
The OpenTelemetry SDK is an implementation of the OpenTelemetry API. Like the API, it also has an implementation for the popular programming languages. Application developers use it to configure OpenTelemetry for their environment.
Get started today
- Review the OpenTelemetry quick start guide.
- Check out New Relic’s OpenTelemetry examples.
- Sign up for New Relic’s native OTLP ingest endpoint.
OpenTelemetry Protocol (OTLP)
The OTLP specification defines the encoding of telemetry data and the protocol used to exchange data between the client and the server. The specification defines how OTLP is implemented over the open source gRPC protocol and HTTP 1.1 transport, and it specifies Protocol Buffers schema that is used for the payloads.
OpenTelemetry semantic conventions
OpenTelemetry defines semantic conventions for common operations that software performs, for example HTTP or database or resource calls are consistent, regardless of which platform or language is used.
For example, if a Python app calls a .NET app, you can rest assured that both of those applications conform to HTTP conventions like the http.method attribute, which is used to specify how the call was made (for example, a get, a post, a put). These will be uniform across the Python and the .NET applications.
Resources are mainly attributes to describe the environment your application is running on like the service name, Kubernetes node, or pod name.
The OpenTelemetry Collector
So, now that you know how the APIs and SDKs work, let’s think about a location like a customs office at an international airport, where all the telemetry data can pass through on its way between the various telemetry tools and observability platforms. The OpenTelemetry Collector is an implementation that serves as a central repository, receiving, processing, and exporting telemetry data, regardless of the tools that send the data. This video walks through the architecture of the OpenTelemetry Collector and how to deploy it in your environment.https://newrelic.com/media/oembed?url=https%3A//newrelic.wistia.com/medias/ki0nft6oft&max_width=0&max_height=0&hash=qgFWrb_yrPBXXL0eHSe0AUfCsySSkDMA2rZoybcmcas
The OpenTelemetry Collector supports many popular open formats of telemetry data and has three main components:
- Receivers to receive the data like the OTLP receiver (to support OpenTelemetry native format) and also other common open source formats like Jaeger for trace data and Prometheus for metrics data
- Processors to configure a pipeline for each of the data sources(metrics, traces and logs) to process the data like filter, sample and enrich your telemetry data in a centralized location.
- Exporters to send data to a backend observability tool, such as New Relic.
The OpenTelemetry Collector can be deployed as a gateway or as an agent.
- If it is deployed as a gateway, all the services report telemetry data to a centralized location where it is then exported to a backend observability tool.
- If it is deployed as an agent, it would run on the same host as the service reporting data to it. In this case the collector can collect telemetry data about the host and act as an infrastructure agent. The collector deployed as an agent can send data directly to a backend or to another collector which would then export it to a backend.
OpenTelemetry exporters and OTLP
The telemetry data needs to be translated to the language of its destination and then transported there. Exporters enable telemetry data to be translated to a particular format that a backend observability system requires. And they also enable the transmission of data to the system. You have the option to use the in-process exporter to directly export data from your service or proxy through the collector, so you can redeploy a new exporter without redeploying the service.
To be part of a pre-release program of native OTLP ingest in New Relic, you can run an OpenTelemetry collector in your environment and configure it to use the OTLP exporter for the collector. It then can export data to New Relic’s native OTLP endpoint in OpenTelemetry’s native data format. Learn more in the following video:https://newrelic.com/media/oembed?url=https%3A//newrelic.wistia.com/medias/6qu9fmdb29&max_width=0&max_height=0&hash=RyNxdIasUeYk7w9wRCyLASuepiZH6noov0YM9Gs_lv4