Back in 2017, we provided insight into the top 30 highest velocity open source projects at the time and the findings were very interesting. This year, we want to look at both CNCF’s project velocity as well as the top 30 highest velocity open source projects in 2020. Furthermore, we are committing to releasing open source project velocity data every six months moving forward.
Tracking projects with the highest developer velocity is an effective way to define the promising platforms that are likely to be successful over the next several years.
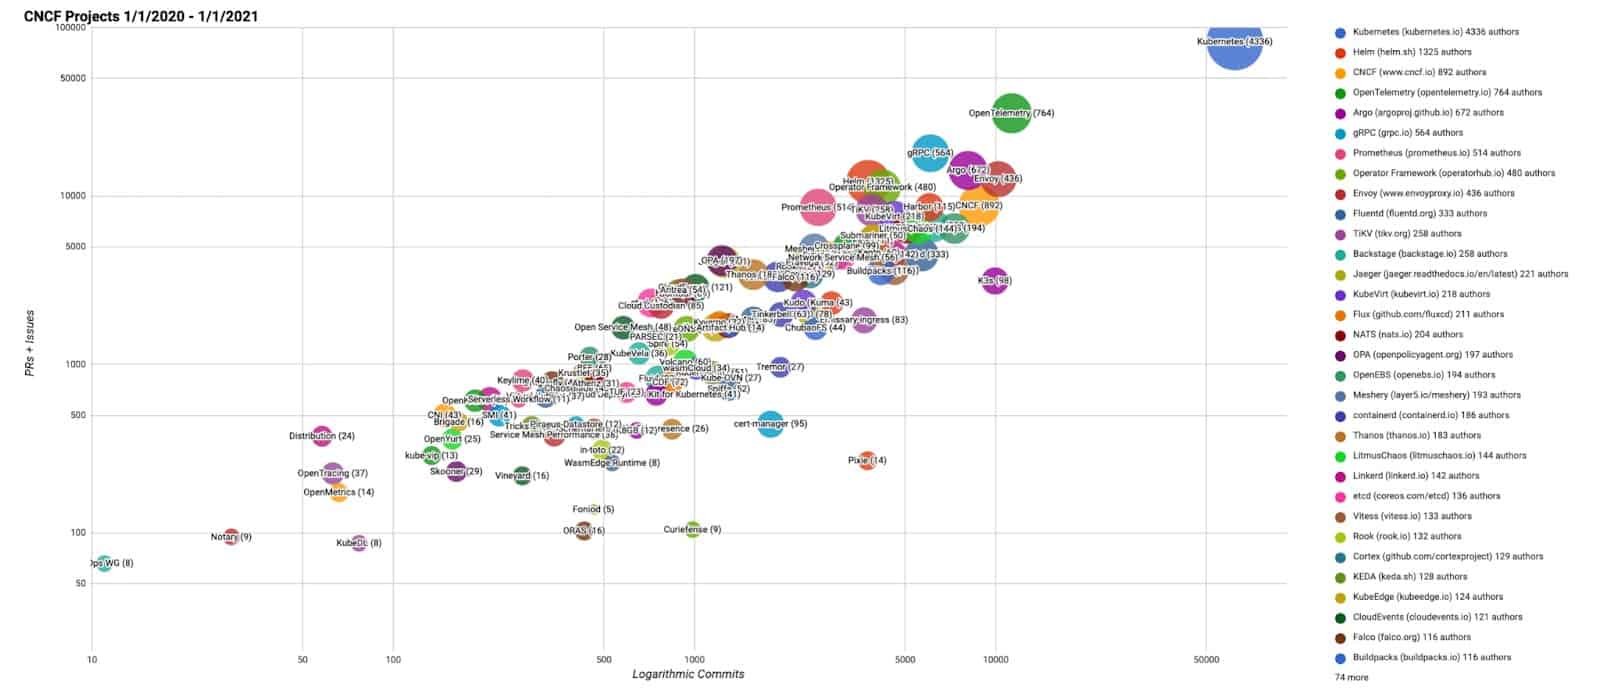
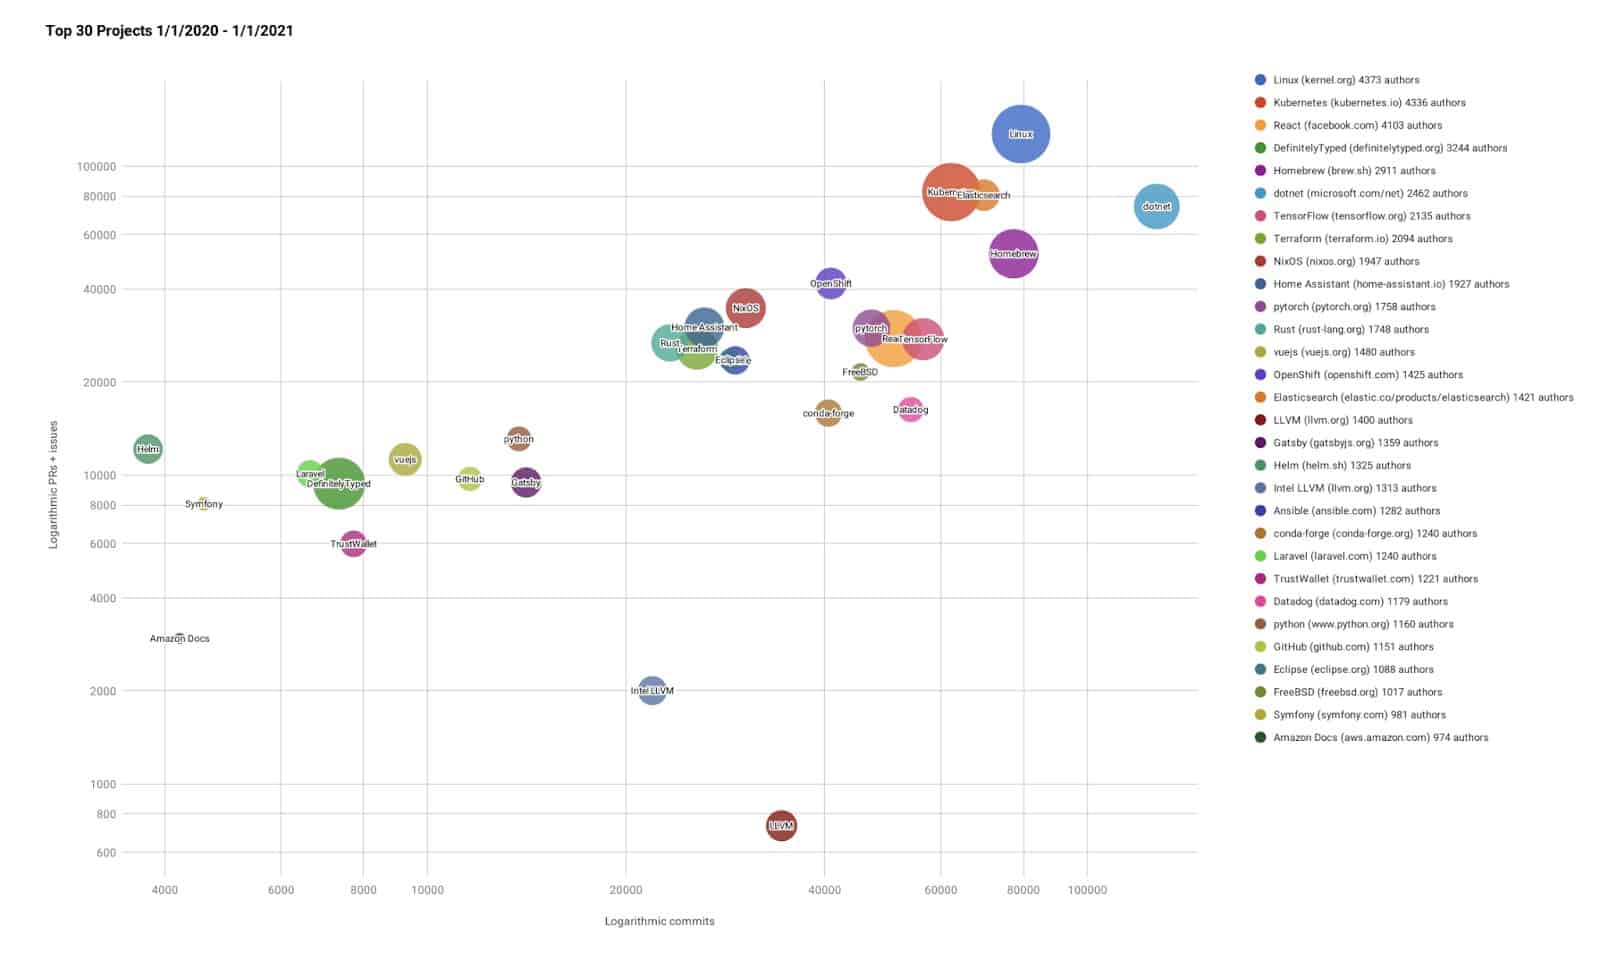
Rather than debate whether to measure them via commits, authors, or comments and pull requests, we use bubble charts to show all three axes of data, and plot on a log-log chart to show the data across large scales. In the graphs, the bubbles’ area is proportional to the number of authors, the y-axis (height) is the total number of pull requests & issues, and the x-axis is the number of commits.
There are many interesting takeaways from this data but these are the main thoughts:
- Kubernetes continues to grow across CNCF projects in terms of contributor activity and is closer to Linux in terms of authors than last ranking
- Rust has grown significantly since the last time we shared this report (this also correlates to a rise of Rustlang projects in CNCF)
- OpenTelemetry and Argo are growing fast since they entered CNCF
CNCF projects
Top 30 GitHub Open Source projects
You can find the rankings for CNCF projects and other open source projects on GitHub, as well as a list and charts on the Google sheets below:
All of the scripts used to generate this data are at https://github.com/cncf/velocity (under an Apache 2.0 license). If you see any errors, please open an issue there.