


Guest post originally published on Particule’s blog by Kevin Lefevre, CTO & Co-founder at Particule
Introduction
In this article we are going to see the limitation of a Prometheus only monitoring stack and why moving to a Thanos based stack can improve metrics retention and also reduce overall infrastructure cost.
Content used for this demo is available here and there and are submit to their respective licenses.
Kubernetes Prometheus Stack
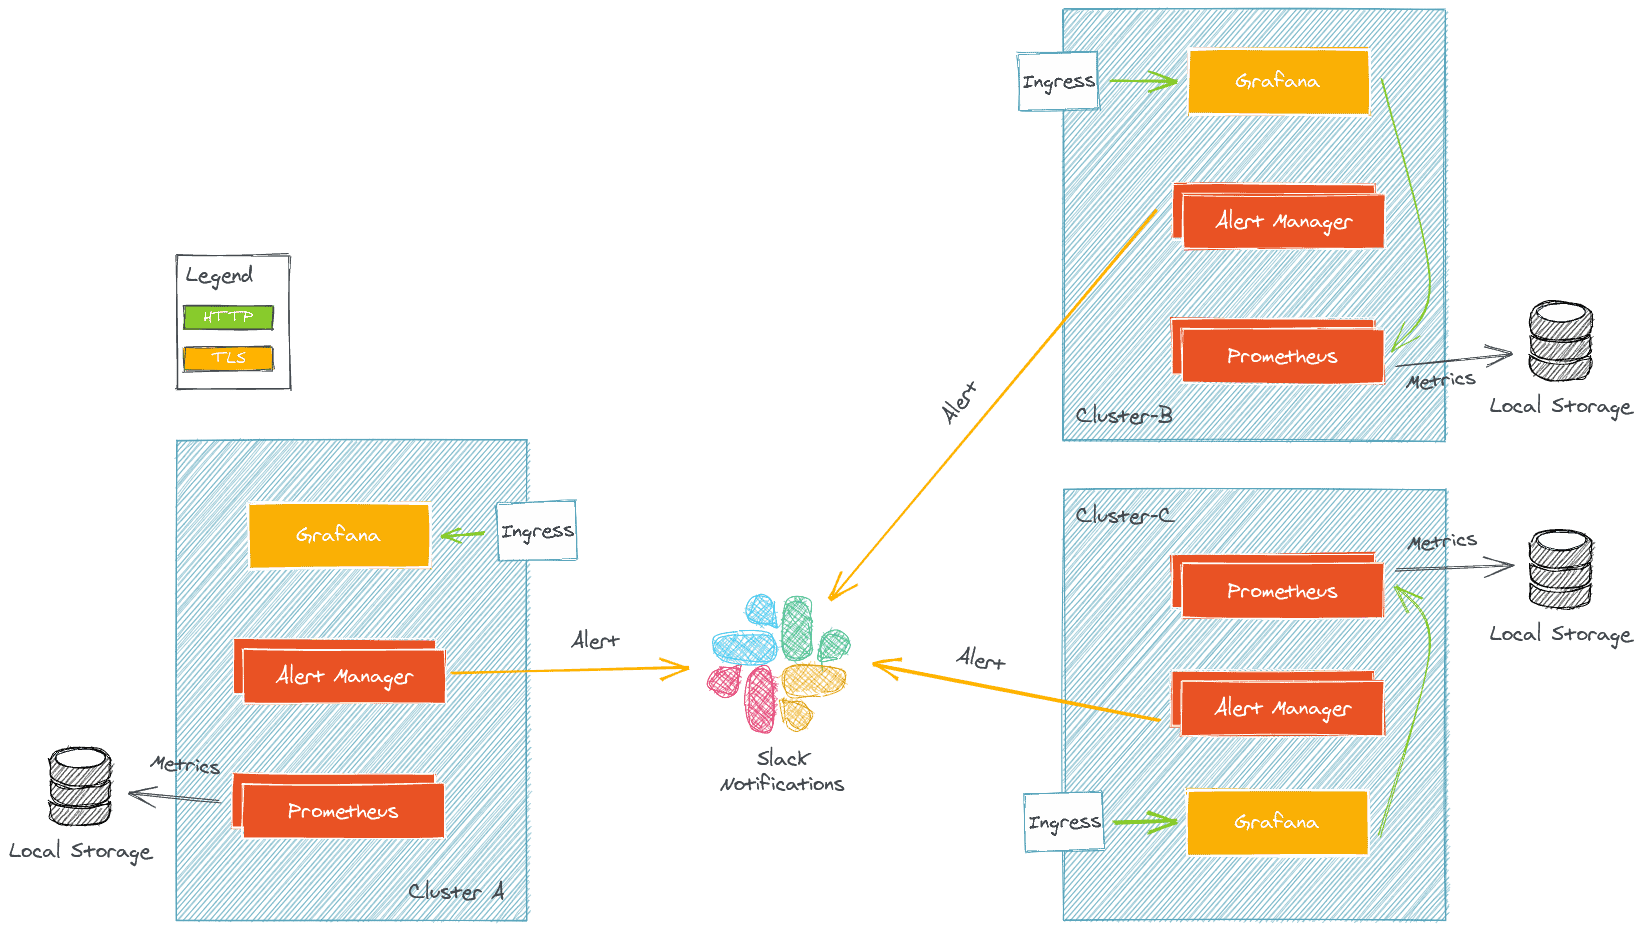
When deploying Kubernetes infrastructure for our customer, it is standard to deploy a monitoring stack on each cluster. This stack is often comprise of several components:
- Prometheus: collect metrics
- AlertManager: send alerts to various provider based on metrics query
- Grafana: fancy dashboards
The simplify architecture is the following:
Caveats
This architecture has some caveats and does not scale out well when increasing the number of cluster from which you want to get metrics.
Multiple Grafana
In this setup each cluster has its own Grafana with its own set of dashboards which can be a pain to maintain.
Storing metrics is expensive
Prometheus stores metrics on disk, you have to make a choice between storage space and metric retention time. If you want to store data for a long time and running on a Cloud Provider, block storage can be expensive if you store terabyte of data on it. Also in production environnement Prometheus is often run either with replication or sharding or both, this can double or even quadruple your storage needs.
Solutions
Multiple Grafana Datasource
It is possible to expose Prometheus endpoints on the external network and to add them as Datasource in a single Grafana. You just need to implements security on the Prometheus external endpoints with mutual TLS or TLS and basic auth for example. The drawback of this solution is that you cannot make calculation based on different data sources.
Prometheus Federation
Prometheus federation allow scraping Prometheuses from Prometheus, this solution works well when you are not scraping a lot of metrics. At scale, if the scrape duration of all your Prometheus targets takes longer than the scrape interval, you might encounter some severe issues.
Prometheus remote write
While remote writing is a solution (and is also implemented by Thanos receiver), we will not discuss the “pushing metrics” part in this article. You can read about the pros and cons of pushing metrics here. It is recommended to push metrics as a last resort or when not trusting multiple cluster or tenant (for example when building a Prometheus as a service offering). Anyway this might be a topic for a further article but we will focus on the scrapping here.
Enter Thanos

Thanos is an “Open source, highly available Prometheus setup with long term storage capabilities“. Thanos is used by a lot of well known companies. It is also a part of the CNCF incubating projects.
One of the main feature of Thanos is to allow for “unlimited” storage. How so ? By using object storage (such as S3), which is offered by almost every cloud provider. If running on premises, object storage can be offered with solution like rook or minio.
How does it work ?
Thanos is running alongside Prometheus. It is common to start with a Prometheus only setup and to upgrade to a Thanos one.
Thanos is split into several components, each having one goal (as every service should be 🙂 ). The component communicate with each other through gRPC.
Thanos Sidecar
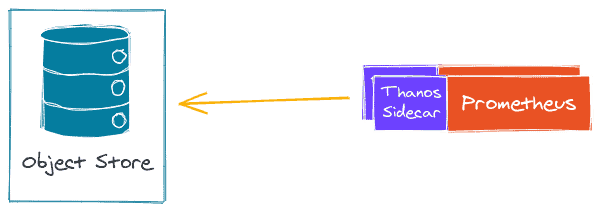
Thanos is running alongside Prometheus (with a sidecar) and export Prometheus metrics every 2h to an object storage. This allow Prometheus to be almost stateless. Prometheus is still keeping 2 hours worth of metrics in memory so you might still loose 2 hours worth of metrics in case of outage (this is problem which should be handle by your Prometheus setup, with HA/Sharding, and not by Thanos).
Thanos sidecar is available out of the box with Prometheus Operator and Kube Prometheus Stack and can be deploy easily. This component act as a store for Thanos Query.
Thanos Store
Thanos store acts as a gateway to translate query to remote object storage. It can also cache some information on local storage. Basically this is the component that allows you to query an object store for metrics. This component acts as a store for Thanos Query
Thanos Compactor
Thanos compactor is a singleton (it is not scalable) that is responsible for compacting and downsampling the metrics stored inside an object store. Downsampling is the action of loosing granularity on your metrics over time. For example you may want to keep your metrics for 2 or 3 year but you do not need so many data points as your metrics from yesterday. This is what the compactor is for, saving you byte on your object storage and therefore saving you $.
Thanos Query
Thanos Query is the main component of Thanos, it is the central point where you send promQL query to. Thanos query exposes a Prometheus compatible endpoints. Then it dispatches query to all of it “stores”. Keep in mind the store may be any other Thanos component that serves metrics. Thanos query can dispatch a query to:
- Another Thanos query (they can be stacked)
- Thanos store
- Thanos sidecar
Thanos query is also responsible for deduplicating the metrics if the same metrics come from different stores or Prometheuses. For example if you have a metric which is in a Prometheus and also inside an object store, Thanos query can deduplicate the metrics. Deduplication also works based on Prometheus replicas and shard in the case of a Prometheus HA setup.
Thanos Query Frontend
As hinted by its name, Thanos Query Frontend acts a frontend for Thanos Query, its goal is to split large query into multiple smaller queries and also to cache the query result (either in memory or in a memcached)
There are also other components such as Thanos Receive in the case of remote write but this is still not the topic of this article.
Multi Cluster Architecture
There are multiple way to deploy these components into multiple Kubernetes Cluster, some are better than the other depending on the use cases and we cannot be exhaustive here.
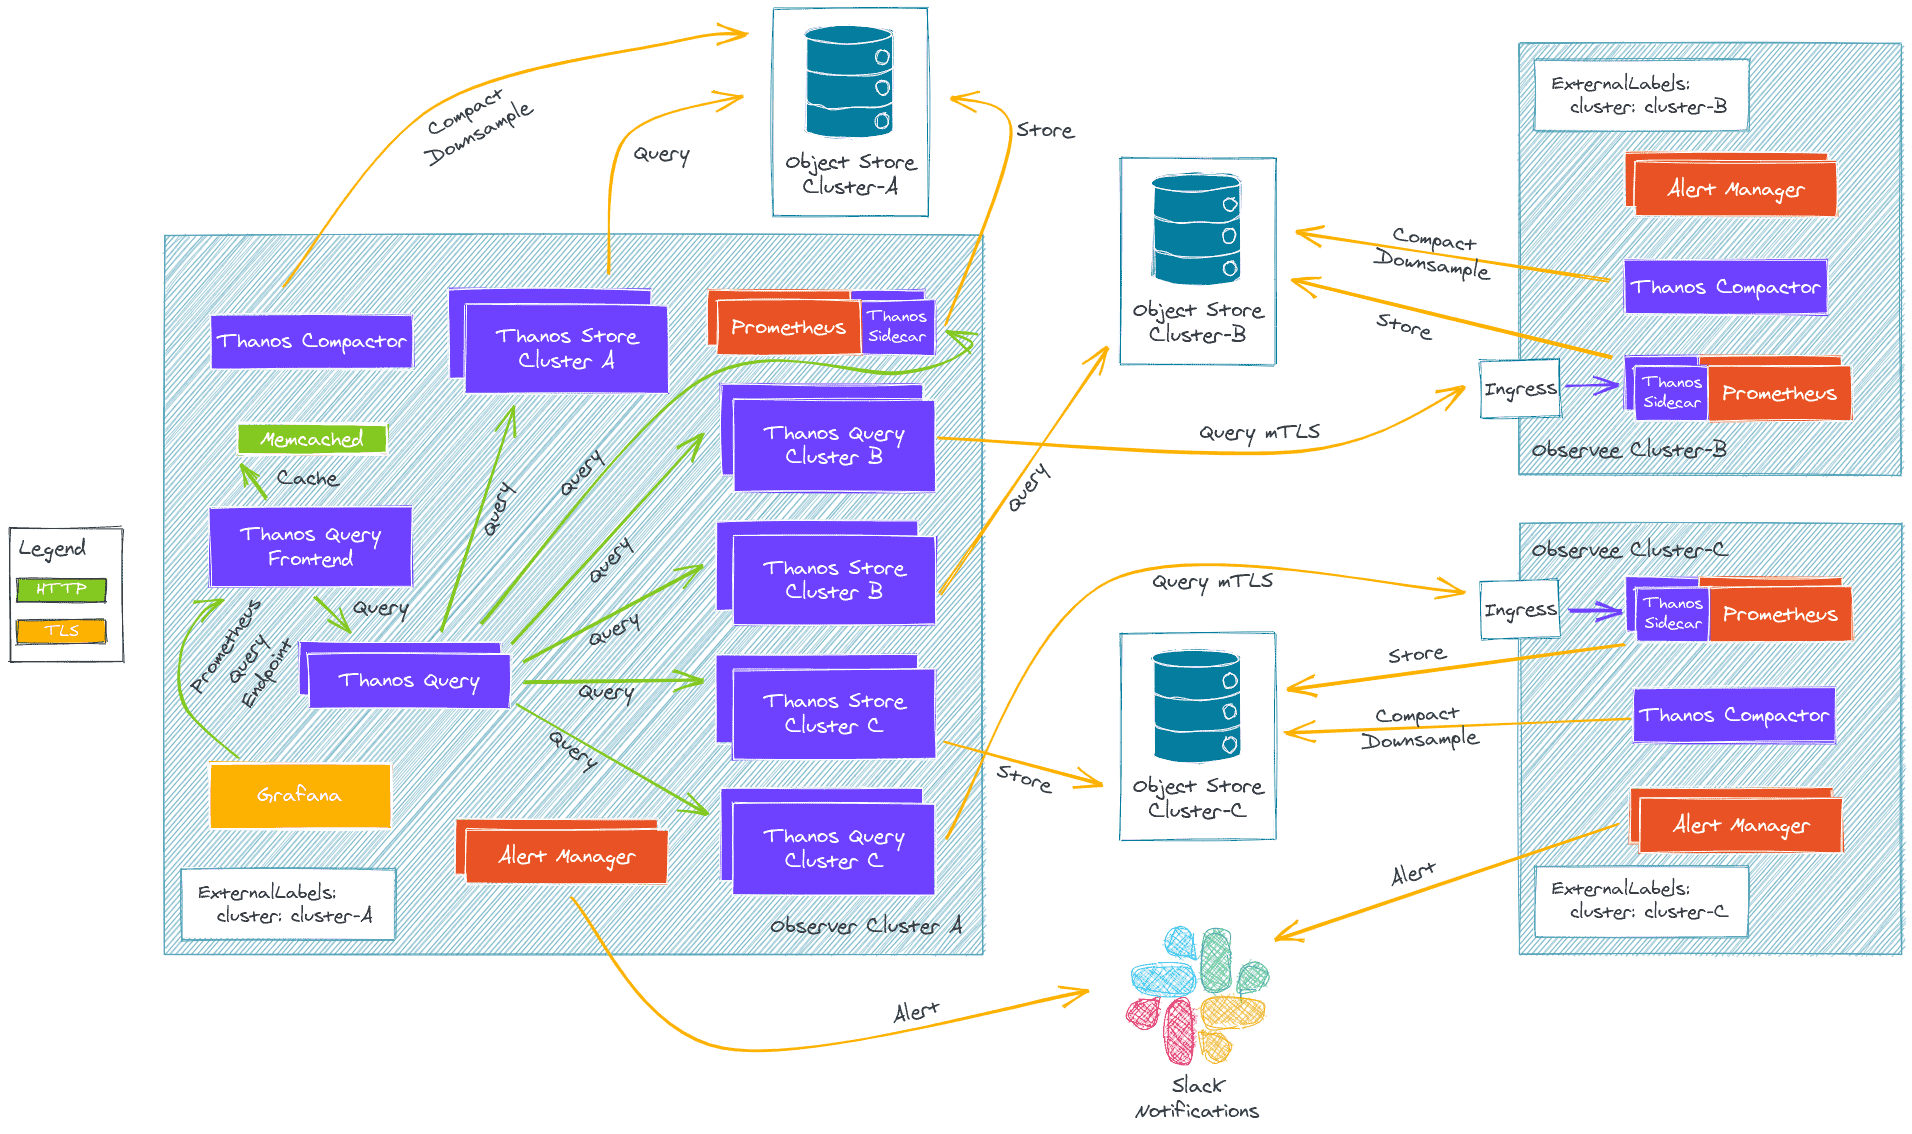
Our example is running on AWS with 2 clusters deployed with tEKS, our all in one solution to deploy production ready EKS clusters on AWS:
- An Observer Cluster
- An Observee Cluster
Our deployment uses the official kube-prometheus-stack and bitnami thanos chart.
Everything is curated inside our terraform-kubernetes-addons repository
The directory structure is the following inside the thanos demo folder:
.
├── env_tags.yaml
├── eu-west-1
│ ├── clusters
│ │ └── observer
│ │ ├── eks
│ │ │ ├── kubeconfig
│ │ │ └── terragrunt.hcl
│ │ ├── eks-addons
│ │ │ └── terragrunt.hcl
│ │ └── vpc
│ │ └── terragrunt.hcl
│ └── region_values.yaml
└── eu-west-3
├── clusters
│ └── observee
│ ├── cluster_values.yaml
│ ├── eks
│ │ ├── kubeconfig
│ │ └── terragrunt.hcl
│ ├── eks-addons
│ │ └── terragrunt.hcl
│ └── vpc
│ └── terragrunt.hcl
└── region_values.yaml
This allow for DRY(Don’t Repeat Yourself) infrastructure and to easily scale the number of AWS accounts, regions and clusters.
Observer Cluster
The observer cluster is our primary cluster from which we are going to query the other clusters:
Prometheus-operator is running with:
- Grafana enabled
- Thanos sidecar that upload to observee specific bucket
kube-prometheus-stack = {
  enabled                     = true
  allowed_cidrs               = dependency.vpc.outputs.private_subnets_cidr_blocks
  thanos_sidecar_enabled      = true
  thanos_bucket_force_destroy = true
  extra_values                = <<-EXTRA_VALUES
    grafana:
      deploymentStrategy:
        type: Recreate
      ingress:
        enabled: true
        annotations:
          kubernetes.io/ingress.class: nginx
          cert-manager.io/cluster-issuer: "letsencrypt"
        hosts:
          - grafana.${local.default_domain_suffix}
        tls:
          - secretName: grafana.${local.default_domain_suffix}
            hosts:
              - grafana.${local.default_domain_suffix}
      persistence:
        enabled: true
        storageClassName: ebs-sc
        accessModes:
          - ReadWriteOnce
        size: 1Gi
    prometheus:
      prometheusSpec:
        replicas: 1
        retention: 2d
        retentionSize: "10GB"
        ruleSelectorNilUsesHelmValues: false
        serviceMonitorSelectorNilUsesHelmValues: false
        podMonitorSelectorNilUsesHelmValues: false
        storageSpec:
          volumeClaimTemplate:
            spec:
              storageClassName: ebs-sc
              accessModes: ["ReadWriteOnce"]
              resources:
                requests:
                  storage: 10Gi
    EXTRA_VALUES
A CA is generated for the observer cluster:
- this CA will be trusted by the observee clusters ingress sidecar
- TLS certs are generated for Thanos querier components that will query the observee clusters
Thanos component deployed:
- All Thanos components are deployed
- Query Frontend which serve as a datasource endpoint for Grafana
- Storegateway are deployed to query the observer bucket
- Query will perform query to the storegateways and the other querier
Additionnal Thanos components deployed:
- Thanos querier configured with TLS are deployed to query each observee cluster
thanos-tls-querier = {
  "observee" = {
    enabled                 = true
    default_global_requests = true
    default_global_limits   = false
    stores = [
      "thanos-sidecar.${local.default_domain_suffix}:443"
    ]
  }
}

thanos-storegateway = {
  "observee" = {
    enabled                 = true
    default_global_requests = true
    default_global_limits   = false
    bucket                  = "thanos-store-pio-thanos-observee"
    region                  = "eu-west-3"
  }
Observee cluster
Observee clusters are Kubernetes clusters with minimal Prometheus/Thanos installation that are going to be queried by the Observer cluster
Prometheus operator is running with:
- Thanos side that upload to observee specific bucket
- Thanos sidecar is published with an
Ingressobject with TLS client auth and trust the observer cluster CA.
 kube-prometheus-stack = {
  enabled                     = true
  allowed_cidrs               = dependency.vpc.outputs.private_subnets_cidr_blocks
  thanos_sidecar_enabled      = true
  thanos_bucket_force_destroy = true
  extra_values                = <<-EXTRA_VALUES
    grafana:
      enabled: false
    prometheus:
      thanosIngress:
        enabled: true
        ingressClassName: nginx
        annotations:
          cert-manager.io/cluster-issuer: "letsencrypt"
          nginx.ingress.kubernetes.io/ssl-redirect: "true"
          nginx.ingress.kubernetes.io/backend-protocol: "GRPC"
          nginx.ingress.kubernetes.io/auth-tls-verify-client: "on"
          nginx.ingress.kubernetes.io/auth-tls-secret: "monitoring/thanos-ca"
        hosts:
        - thanos-sidecar.${local.default_domain_suffix}
        paths:
        - /
        tls:
        - secretName: thanos-sidecar.${local.default_domain_suffix}
          hosts:
          - thanos-sidecar.${local.default_domain_suffix}
      prometheusSpec:
        replicas: 1
        retention: 2d
        retentionSize: "6GB"
        ruleSelectorNilUsesHelmValues: false
        serviceMonitorSelectorNilUsesHelmValues: false
        podMonitorSelectorNilUsesHelmValues: false
        storageSpec:
          volumeClaimTemplate:
            spec:
              storageClassName: ebs-sc
              accessModes: ["ReadWriteOnce"]
              resources:
                requests:
                  storage: 10Gi
    EXTRA_VALUES
Thanos components deployed:
- Thanos compactor to manage downsampling for this specific cluster
thanos = {
  enabled = true
  bucket_force_destroy = true
  trusted_ca_content      = dependency.thanos-ca.outputs.thanos_ca
  extra_values = <<-EXTRA_VALUES
    compactor:
      retentionResolution5m: 90d
    query:
      enabled: false
    queryFrontend:
      enabled: false
    storegateway:
      enabled: false
    EXTRA_VALUES
}
A little bit more diving
Let’s check what is running on our clusters. On the observer we have:
kubectl -n monitoring get pods
NAME                                                        READY   STATUS    RESTARTS   AGE
alertmanager-kube-prometheus-stack-alertmanager-0           2/2     Running   0          120m
kube-prometheus-stack-grafana-c8768466b-rd8wm               2/2     Running   0          120m
kube-prometheus-stack-kube-state-metrics-5cf575d8f8-x59rd   1/1     Running   0          120m
kube-prometheus-stack-operator-6856b9bb58-hdrb2             1/1     Running   0          119m
kube-prometheus-stack-prometheus-node-exporter-8hvmv        1/1     Running   0          117m
kube-prometheus-stack-prometheus-node-exporter-cwlfd        1/1     Running   0          120m
kube-prometheus-stack-prometheus-node-exporter-rsss5        1/1     Running   0          120m
kube-prometheus-stack-prometheus-node-exporter-rzgr9        1/1     Running   0          120m
prometheus-kube-prometheus-stack-prometheus-0               3/3     Running   1          120m
thanos-compactor-74784bd59d-vmvps                           1/1     Running   0          119m
thanos-query-7c74db546c-d7bp8                               1/1     Running   0          12m
thanos-query-7c74db546c-ndnx2                               1/1     Running   0          12m
thanos-query-frontend-5cbcb65b57-5sx8z                      1/1     Running   0          119m
thanos-query-frontend-5cbcb65b57-qjhxg                      1/1     Running   0          119m
thanos-storegateway-0                                       1/1     Running   0          119m
thanos-storegateway-1                                       1/1     Running   0          118m
thanos-storegateway-observee-storegateway-0                 1/1     Running   0          12m
thanos-storegateway-observee-storegateway-1                 1/1     Running   0          11m
thanos-tls-querier-observee-query-dfb9f79f9-4str8           1/1     Running   0          29m
thanos-tls-querier-observee-query-dfb9f79f9-xsq24           1/1     Running   0          29m

kubectl -n monitoring get ingress
NAME                            CLASS    HOSTS                                            ADDRESS                                                                         PORTS     AGE
kube-prometheus-stack-grafana   <none>   grafana.thanos.teks-tg.clusterfrak-dynamics.io   k8s-ingressn-ingressn-afa0a48374-f507283b6cd101c5.elb.eu-west-1.amazonaws.com   80, 443   123m
And on the observee :
kubectl -n monitoring get pods
NAME                                                        READY   STATUS    RESTARTS   AGE
alertmanager-kube-prometheus-stack-alertmanager-0           2/2     Running   0          39m
kube-prometheus-stack-kube-state-metrics-5cf575d8f8-ct292   1/1     Running   0          39m
kube-prometheus-stack-operator-6856b9bb58-4cngc             1/1     Running   0          39m
kube-prometheus-stack-prometheus-node-exporter-bs4wp        1/1     Running   0          39m
kube-prometheus-stack-prometheus-node-exporter-c57ss        1/1     Running   0          39m
kube-prometheus-stack-prometheus-node-exporter-cp5ch        1/1     Running   0          39m
kube-prometheus-stack-prometheus-node-exporter-tnqvq        1/1     Running   0          39m
kube-prometheus-stack-prometheus-node-exporter-z2p49        1/1     Running   0          39m
kube-prometheus-stack-prometheus-node-exporter-zzqp7        1/1     Running   0          39m
prometheus-kube-prometheus-stack-prometheus-0               3/3     Running   1          39m
thanos-compactor-7576dcbcfc-6pd4v                           1/1     Running   0          38m

kubectl -n monitoring get ingress
NAME                                   CLASS   HOSTS                                                   ADDRESS                                                                         PORTS     AGE
kube-prometheus-stack-thanos-gateway   nginx   thanos-sidecar.thanos.teks-tg.clusterfrak-dynamics.io   k8s-ingressn-ingressn-95903f6102-d2ce9013ac068b9e.elb.eu-west-3.amazonaws.com   80, 443   40m
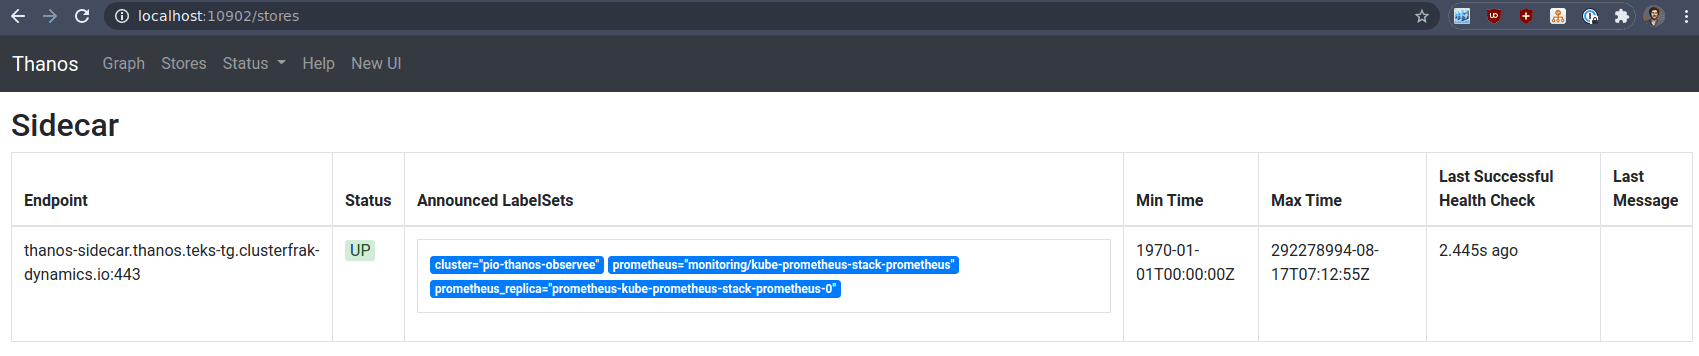
Our TLS querier are supposed to be able to query the observee cluster for metrics. Let’s check their behavior:
k -n monitoring logs -f thanos-tls-querier-observee-query-687dd88ff5-nzpdh

level=info ts=2021-02-23T15:37:35.692346206Z caller=storeset.go:387 component=storeset msg="adding new storeAPI to query storeset" address=thanos-sidecar.thanos.teks-tg.clusterfrak-dynamics.io:443 extLset="{cluster=\"pio-thanos-observee\", prometheus=\"monitoring/kube-prometheus-stack-prometheus\", prometheus_replica=\"prometheus-kube-prometheus-stack-prometheus-0\"}"
So this querier pods can query my other cluster, if we check the webUI, we can see the stores:
kubectl -n monitoring port-forward thanos-tls-querier-observee-query-687dd88ff5-nzpdh 10902
So great but I have only one store ! Remember when we said the querier can stack on top of each other. In our observer cluster we have standard http querier that can query other components like in the architecture drawing.
kubectl -n monitoring port-forward thanos-query-7c74db546c-d7bp8 10902
Here we can see all the store that have been added to our central querier:
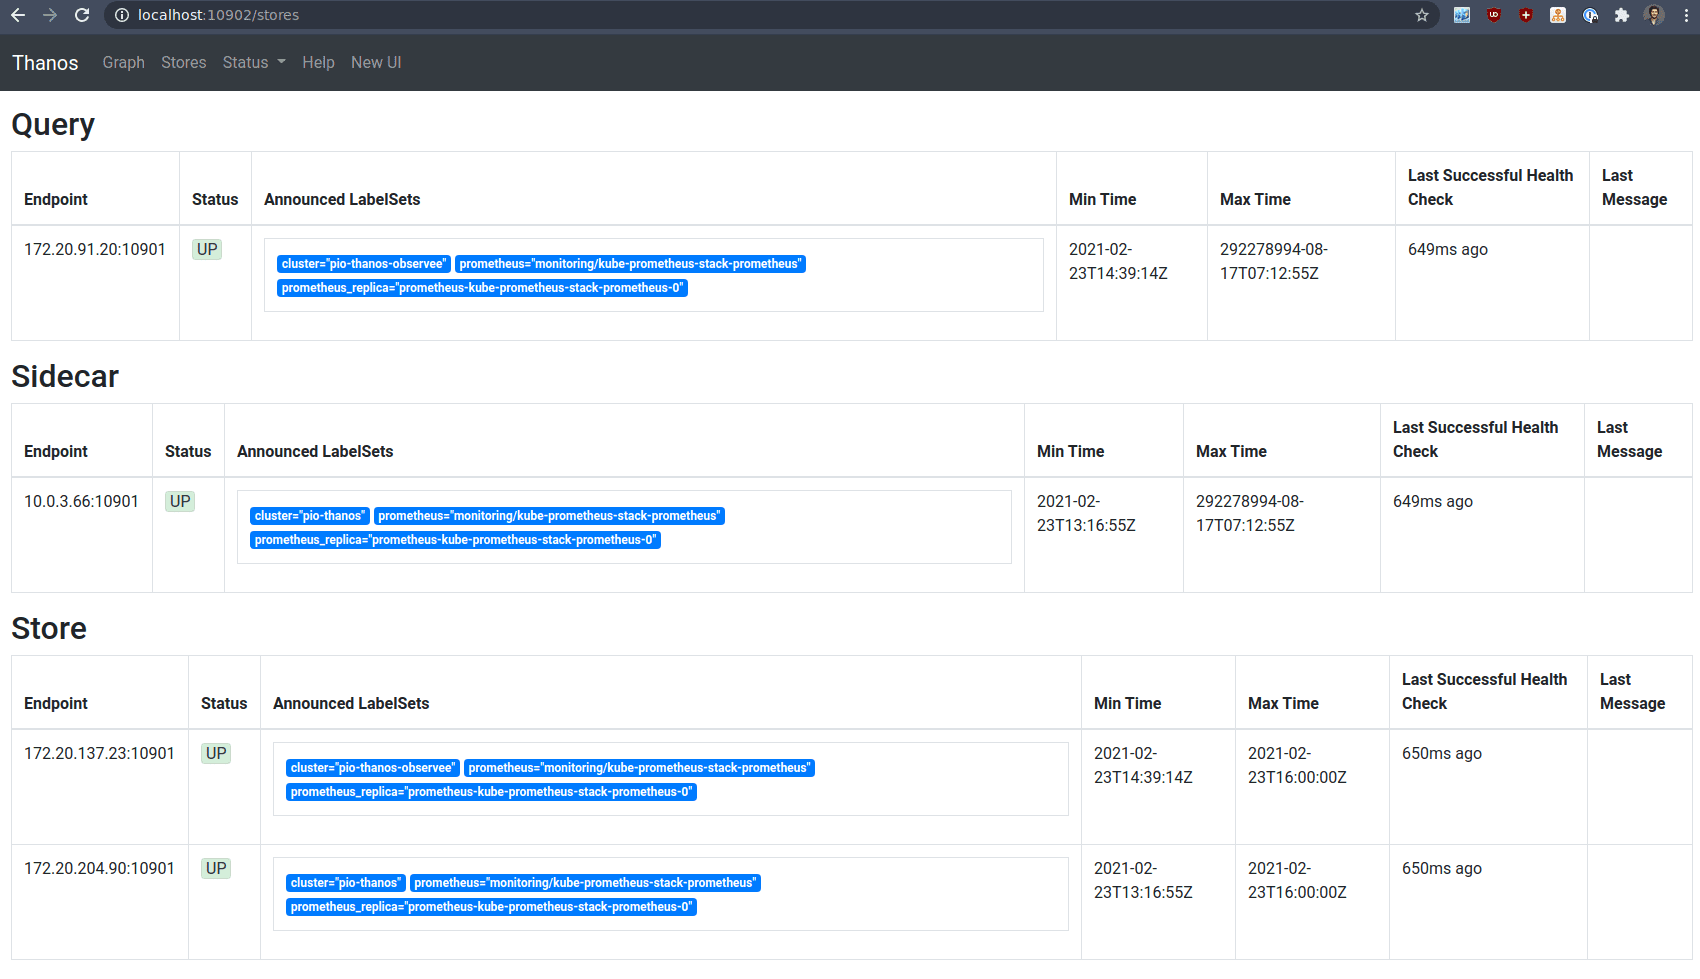
- The observer cluster local thanos sidecar
- Our storegateway (one for the remote observee cluster and one for the local observer cluster)
- The local TLS querier which can query the observee sidecar
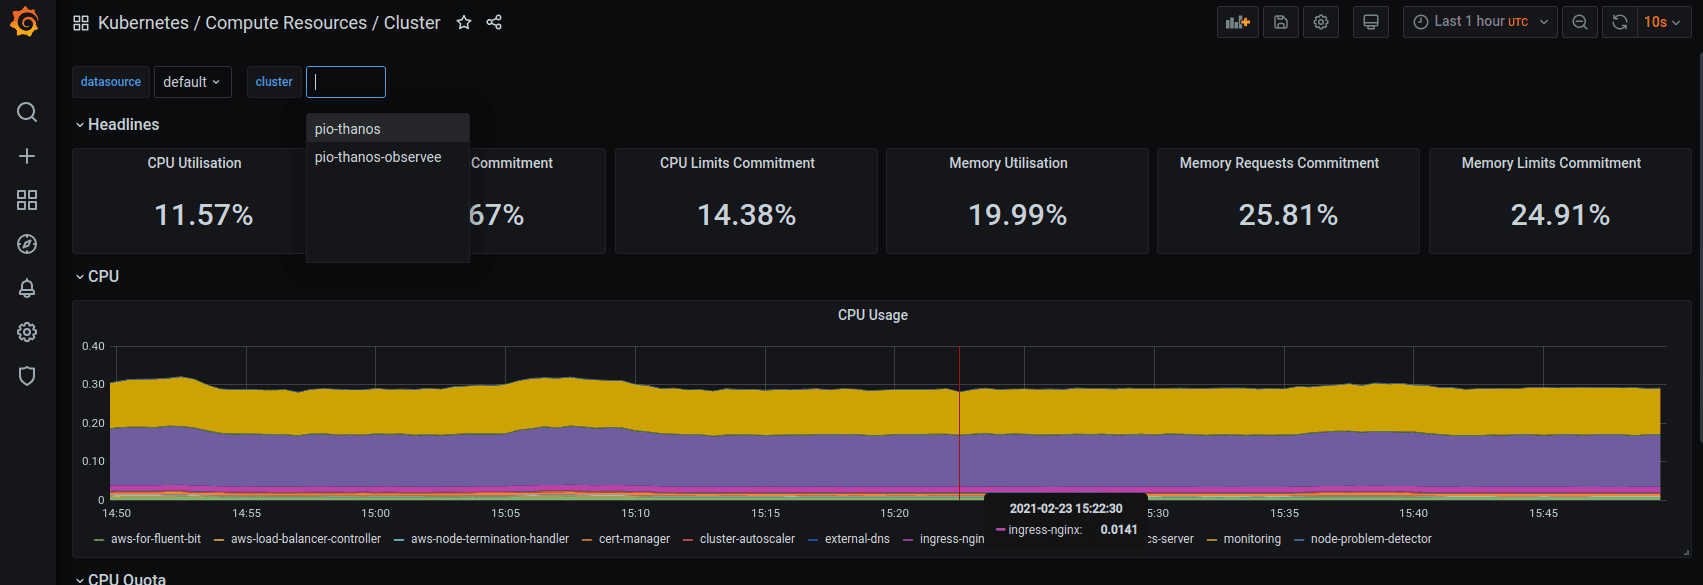
Visualisation in Grafana
Finally we can head to Grafana and see how the default Kubernetes dashboard have been made compatible with multicluster.
Conclusion
Thanos is a really complex system with a lot of moving parts, we did not deep dive on the specific custom configuration involved here as it would take too much time.
We offer a quite complete implementation for AWS in our tEKS repository that abstract a lot of the complexity (mostly the mTLS part) and allow to do lot of customizations. You can also use our terraform-kubernetes-addons module as a standalone component. We plan to support other cloud provider in the future. Don’t hesitate to contact us through Github Issues on either one of this projects.
There are many possible Thanos implementations that might suit you depending on your infrastructure and your requirements.
If you want to dive deeper into Thanos you can check their official kube-thanos repository and also their recommendation about cross cluster communication
And of course, we are happy to help you setup your cloud native monitoring stack, contact us at contact@particule.io 🙂
You can also reach us every day on the CNCF/Kubernetes Slack channels.