
Today we are very excited to release our Cloud Native Survey 2020. The report showcases the CNCF Cloud Native Survey results, which was conducted this year for the eighth time.
The results show continued growth of cloud native tools and technologies, which has only accelerated due to increased demand for resources driven by the pandemic. We surveyed our extended community during May and June 2020, while most of us worked from home and spent hours on Zoom.
This years’ survey had a strong response from employees of large organizations, demonstrating that the use of cloud native in enterprises. Two-thirds of respondents were from organizations with more than 100 employees, and 30% were from organizations with more than 5,000 employees. This represents both software vendors and consumers, as 54% of respondents were part of an end user organization.
In terms of the results, we reached impressive milestones this year, particularly in the use of containers and container orchestration. Some 92% of respondents now say they use containers in production, an extraordinary 300% increase from just 23% in our first survey in March 2016. This is also a significant year-over-year jump from last year when it was 84% and 73% in 2018.
Additionally, 91% of respondents report using Kubernetes, 83% of them in production. This continues a steady increase in use in production from 78% last year and just 58% in 2018.
Other key takeaways from this year’s results include:
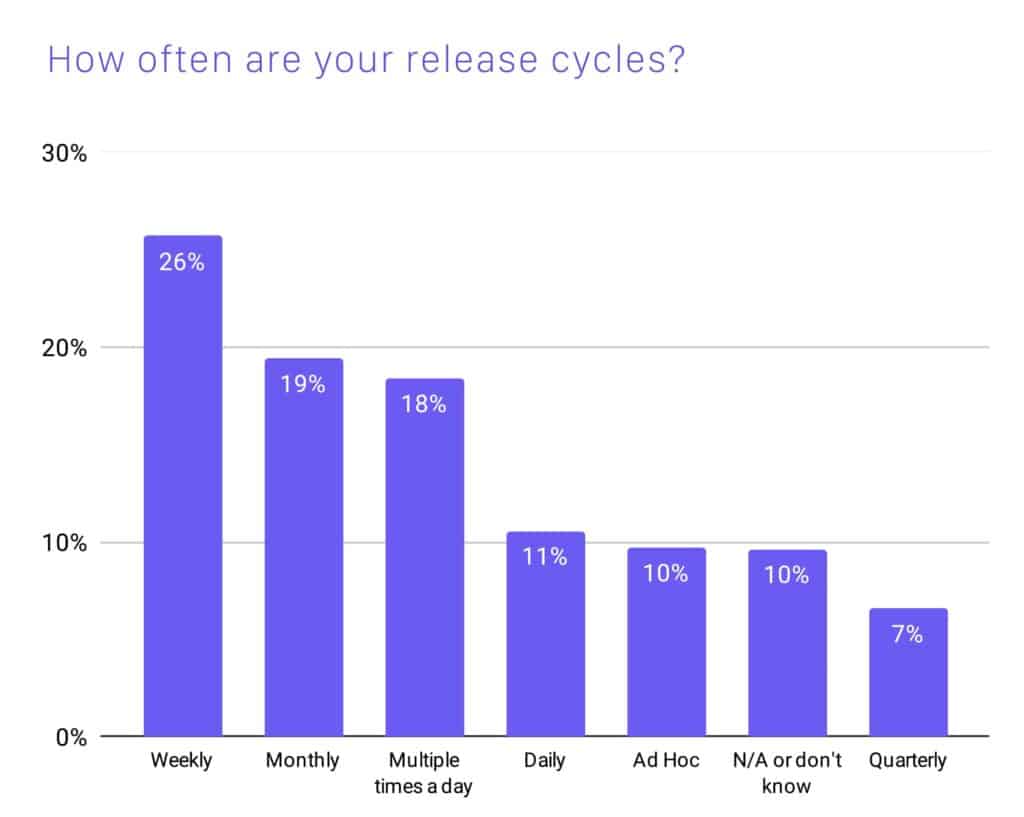
For a third year, we see release cycles continuing to speed up. The percentage of those who release software daily, or even multiple times a day, has increased to 29% from 27% last year. Weekly release cycles are still the most common (26%), but more than half of respondents (55%) release weekly or more frequently.
CI/CD and storage tools are used broadly, while serverless tools, service meshes, and service proxies are growing.
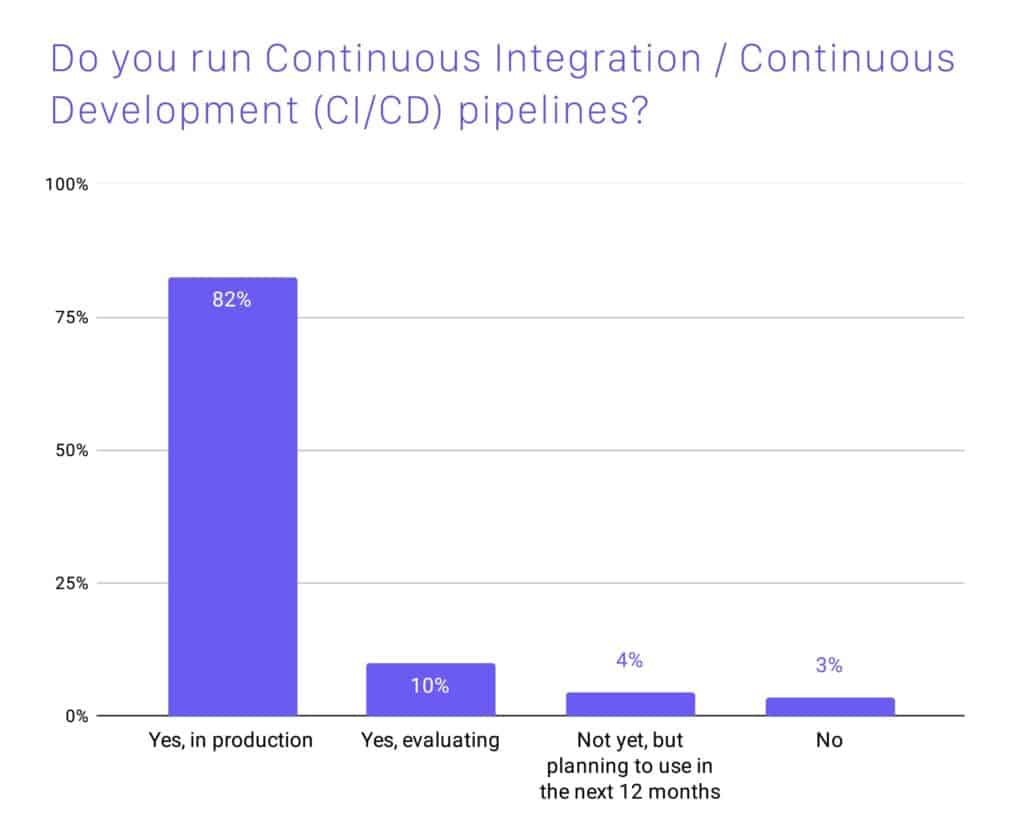
- As an essential aspect of DevOps, CI/CD is used widely in production. An impressive 82% of respondents use CI/CD pipelines in production. The three most used CI/CD tools are Jenkins (53%), GitLab (36%), and GitHub Actions (20%).
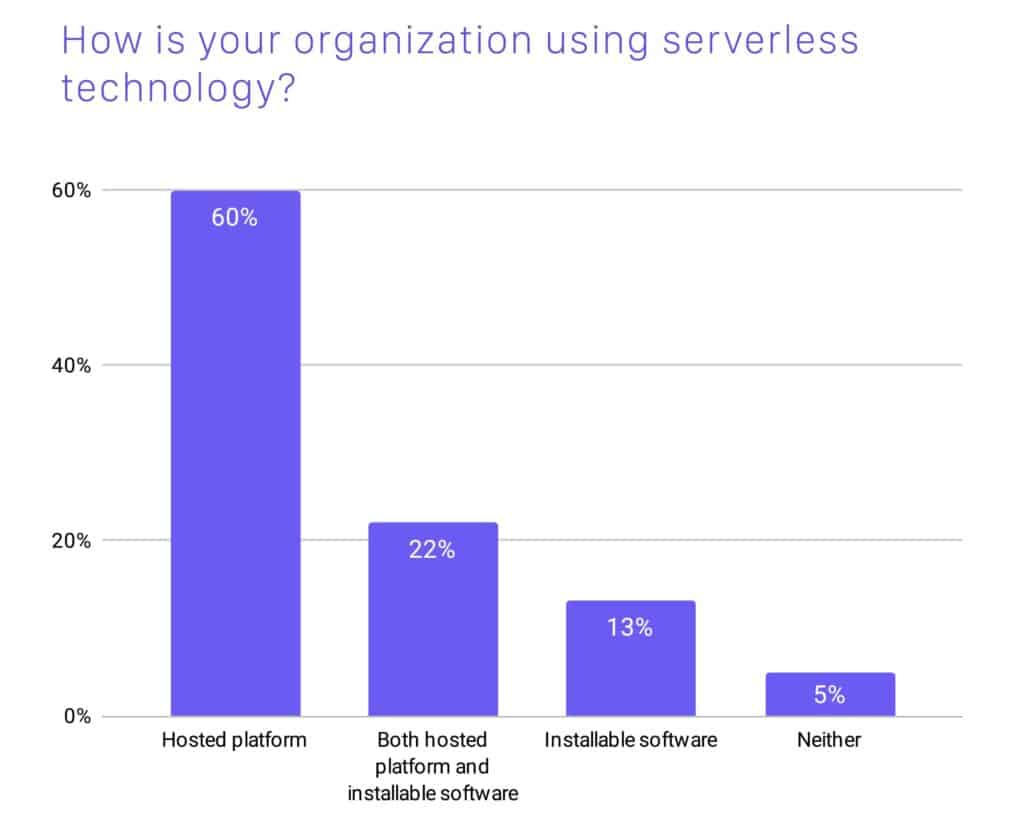
- Just under a third (30%) of respondents use serverless technologies in production. Another 21% are evaluating serverless, and 14% plan to use it in the next 12 months. The majority of those using serverless technology (60%) use a hosted platform; 13% use installable software, and 22% use both.
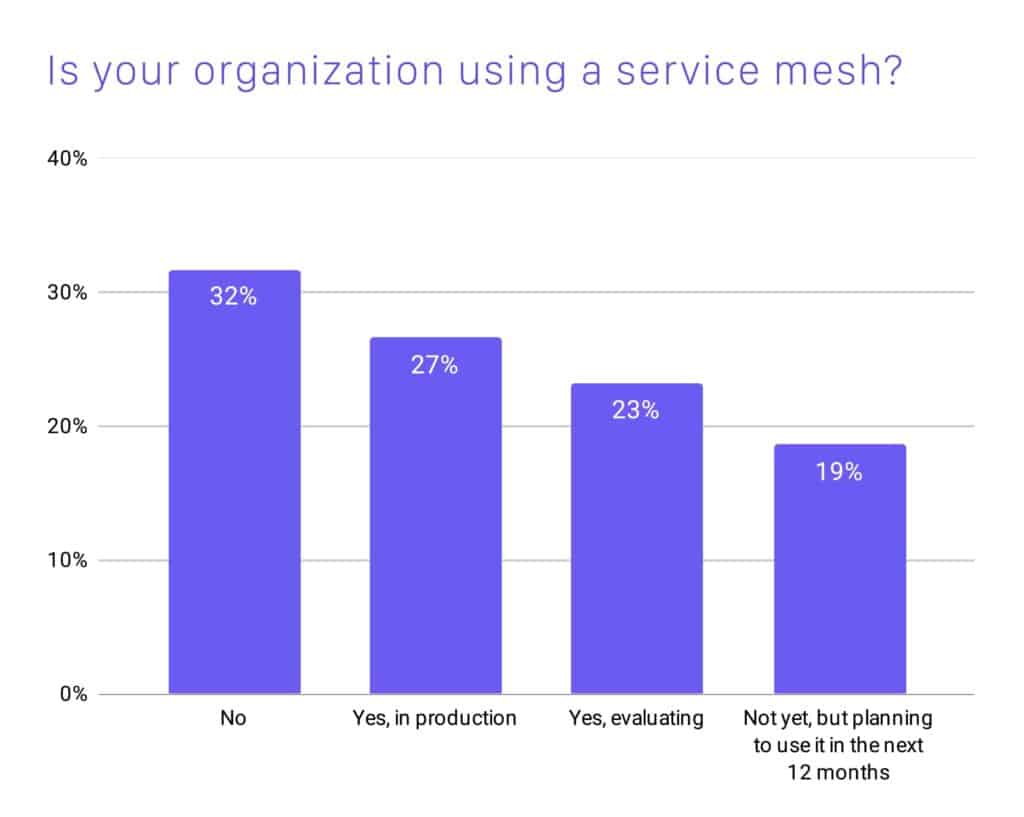
- This year, 27% of respondents use a service mesh in production, a 50% increase over last year. We expect this growth to continue, with 23% evaluating a service mesh and another 19% planning to use one in the next 12 months.
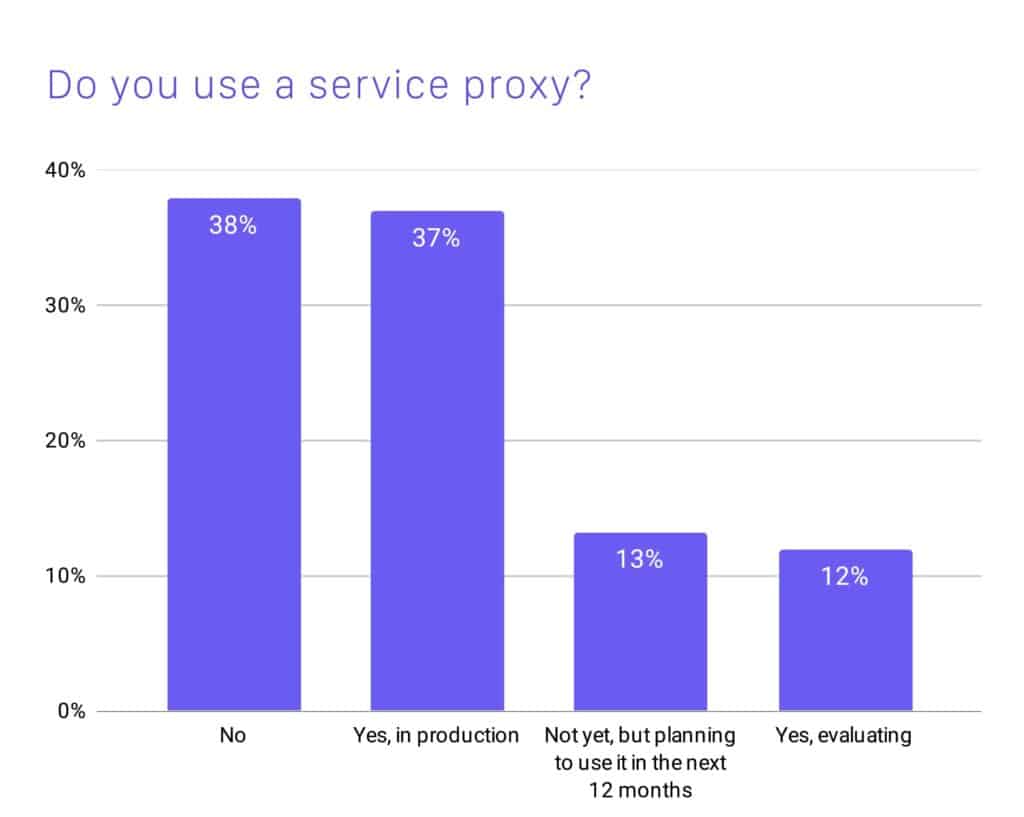
- 37% of respondents use a service proxy in production. Another 12% are evaluating a service proxy, and 13% plan to use one in the next 12 months. The top ingress providers for 2020 are NGINX (62%), Envoy (37%), and HAProxy (27%). If we adjust for new responses added, Envoy has increased by 116% in use as an ingress provider for 2020.
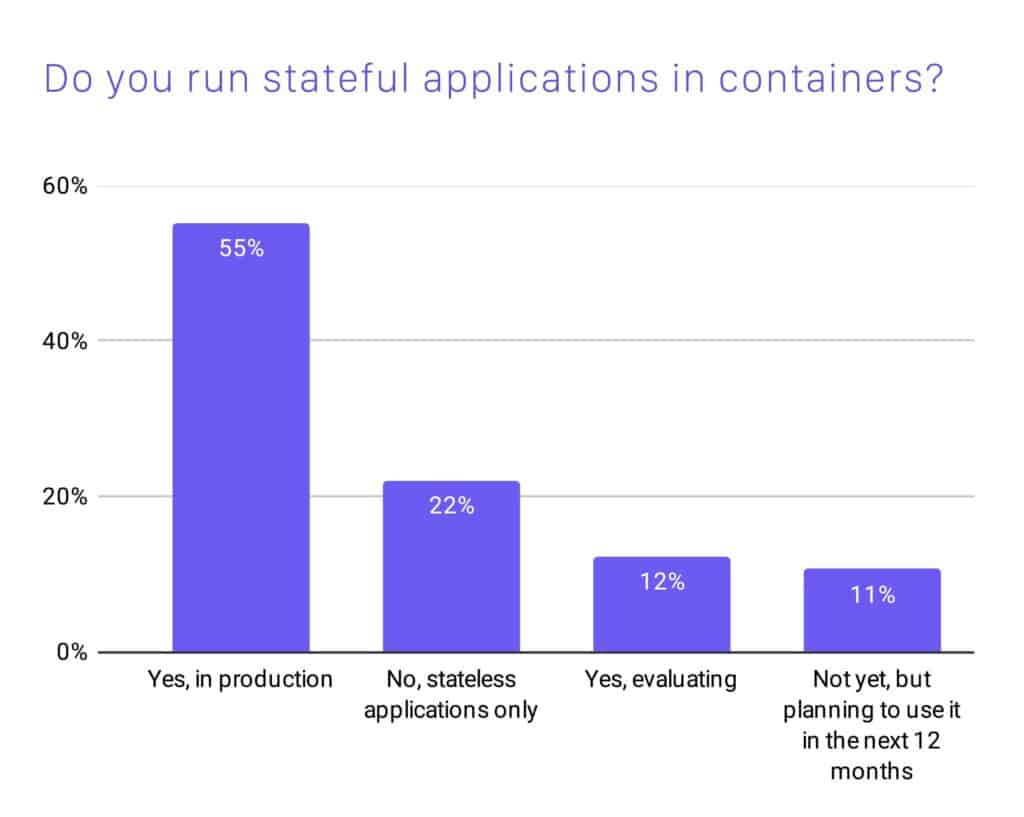
- Cloud native storage has exploded in recent years, expanding to include different storage offerings, including centralized, distributed, sharded, and hyper-converged. 55% of respondents use stateful applications in containers in production. Another 12% are evaluating them, and 11% plan to use them in the next 12 months.
For more insight into the results, including a look at the use of automation, containers, cloud, and more, please view the full report. The report data is available for download on GitHub.
We’d like to extend a big thank you to everyone who took part in the survey! Keep your eyes peeled for a call to participate in the next survey early next year.
If you have any questions or comments, please feel free to reach out.