


Guest post originally published on Rookout’s blog by Josh Hendrick, Senior Solutions Engineer at Rookout
Over the recent years, software development organizations have seen a major shift in where they build and run their applications. Teams have transitioned from building applications that run exclusively on-prem to microservices applications that are built to run natively in the cloud. This shift gives businesses more flexibility as well as quick and easy access to enterprise services without the need to host costly applications and infrastructure. As part of this migration, many organizations have adopted the use of containers which aim to solve many issues developers have typically faced in portability and scalability of applications. Kubernetes has quickly become the defacto standard for container orchestration when building modern cloud native applications.
While the power of cloud native and Kubernetes based technologies promises organizations the ability to build software quickly and scale effortlessly, debugging these Kubernetes based applications can often prove challenging.
Traditional Challenges with Debugging Kubernetes Based Applications
One of the biggest challenges with debugging applications built to run in Kubernetes is that local debugging is a major obstacle for developers. While there are Kubernetes solutions like Minikube which allow you to spin up clusters locally on your laptop or desktop, the fact is that there are oftentimes major differences between Kubernetes platforms that make such an approach impractical. For example, if you’ve built an application and are running it in production in Google Cloud’s managed Kubernetes offering GKE, local testing in Minikube may be more trouble than it’s worth. Anytime you’re debugging, you ideally want an environment which mirrors your production environment as closely as possible.
Many developers choose to utilize local debugging options such as Docker compose, which is a tool that allows the running of multi-container Docker applications. This approach allows developers to define a YAML file containing information needed to run the relevant services making up the application. While this approach can often work well for local debugging, there are security and infrastructure specific conditions which might not be reproducible in a Docker compose environment when your production environment is Kubernetes. There are solutions which are being developed that aim to make local development easier such as telepresence but these require that you proxy into the network where Kubernetes is running, which could be a security risk.
Looking beyond the infrastructure itself, Kubernetes has many new commands and technical areas to become familiar with in order to effectively debug the services you develop. Debugging applications running in Kubernetes pods can be inherently difficult due to the fact that pods are ephemeral in nature and can be spun down anytime based on the Kubernetes scheduler (yes, even if you are in the middle of debugging one of them).
Real Time Debugging of Production Workloads
Looking at the debugging challenges above, it’s clear that there is room for improvement and potentially a better approach. One such approach, enabled by Rookout, allows for debugging applications live in their native environments by allowing developers to add “virtual” log lines on the fly and collect snapshots of data from those running applications. By simply placing a “Non-breaking breakpoint” on a line of code, developers can extract information typically only found in a local debugger from their applications without ever stopping them or needing to redeploy.
With this approach, developers can effectively debug their code by decoupling the code itself from the underlying infrastructure where it’s running. This allows teams developing applications for Kubernetes to focus on what their code is doing when a defect happens. Teams spend far too much time trying to reproduce defects in staging or pre-prod environments where attempts are made as much as possible to simulate the configuration of production environments. While this can be possible, it’s far more effective to debug and collect relevant data from the same environment where the defect occurs. Having a real time production grade debugging tool in place can dramatically improve the understandability of the code developers both write and maintain.
Deploying a Kubernetes Application and Real-Time Debugging
One of the best ways of understanding how real time debugging works is to take a look at a hands-on example. In this section, we will look at the following:
- Instrumenting a sample application with the Rookout SDK
- Deploying that application into a Kubernetes cluster
- Note: We’ll assume that you have a cluster provisioned and can connect to it with kubectl for this example if you want to follow along.
- Perform real-time debugging of the application
Instrumenting the Application
To start, let’s take a look at how the Rookout SDK is configured within an application. This example will use a To-Do application written in Python.
- To start, open up the repository found here: https://github.com/Rookout/tutorial-python
- Next open up the app.py file
- Scroll down to the bottom of the file and take note of the following:
import rook
rook.start()
This is how you import the rook package into your application and tell it to start processing. The SDK should be started just before the application begins executing.
- Note that the rook package can be installed via the following command:
pip install rook
- There is a Docker file inside the repository which allows you to build an image, but for this example, to simplify things we’ll use an image which has already been built and is hosted on the Rookout Docker Huge page here: https://hub.docker.com/r/rookout/tutorial-python
That’s all that is required to configure the Rookout SDK to work within an application. In short, the Rookout SDK is deployed as a dependency of your application running side by side with your codebase. In the next section, we will take a look at deploying the application to a Kubernetes cluster.
Deploying the Application
Now, let’s deploy the application to a Kubernetes cluster.
- To start, you’ll want to clone the repository here which contains relevant Kubernetes YAML files for the Deployment and Service in Kubernetes: https://github.com/Rookout/deployment-examples/tree/master/python-kubernetes/rookout-service
- Before they’re ready for deployment we will make a few changes to ensure the correct environment variables are being passed to Rookout:
- Open app-deployment.yaml. Notice we’re using the tutorial-python image from Docker Hub:
containers:
– name: rookout-demo-app
image: rookout/tutorial-python
- Next, notice that we’re passing the Rookout token as an environment variable. The token is a key specific to your organization and should be kept private. We’ll be creating a secret key to store this in our cluster later.
env:
– name: ROOKOUT_TOKEN
valueFrom:
secretKeyRef:
name: rookout
key: token
- When using Rookout it’s also helpful to pass a label which is tied to your application instance so that when using Rookout you can filter on specific application instances or services that you want to debug or collect data from. A label is simply a name:value pair which you can name as you see fit. To do this we’ll add one additional environment variable with a label:
env:
– name: ROOKOUT_LABELS
value: “app:python-tutorial”
– name: ROOKOUT_TOKEN
valueFrom:
secretKeyRef:
name: rookout
key: token
- Finally, we’ll create the Kubernetes secret and deploy the application:
- Create the secret:
- kubectl create secret generic rookout –from-literal=token=<Your-Rookout-Token>
- Deploy the application:
- kubectl apply -f app-deployment.yaml -f app-service.yaml
- And finally access the external IP address of our service:
- kubectl get svc rookout-demo-app-service
From here you should be able to access the To-Do application front end running in the Kubernetes cluster.

Real-time Debugging
Finally, we’re ready to debug the application while it’s running on the fly!
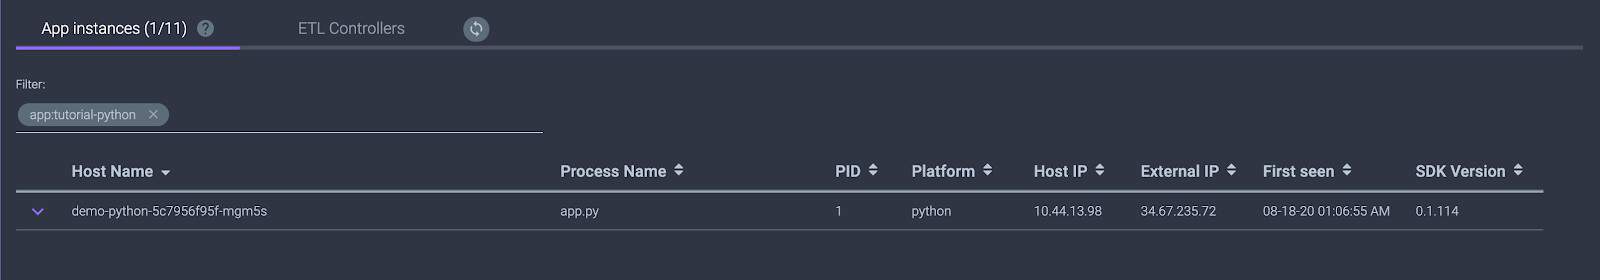
- After setting up the Rookout SDK and deploying the application, the connected Application instance should be viewable from the App Instances page within Rookout as shown below:
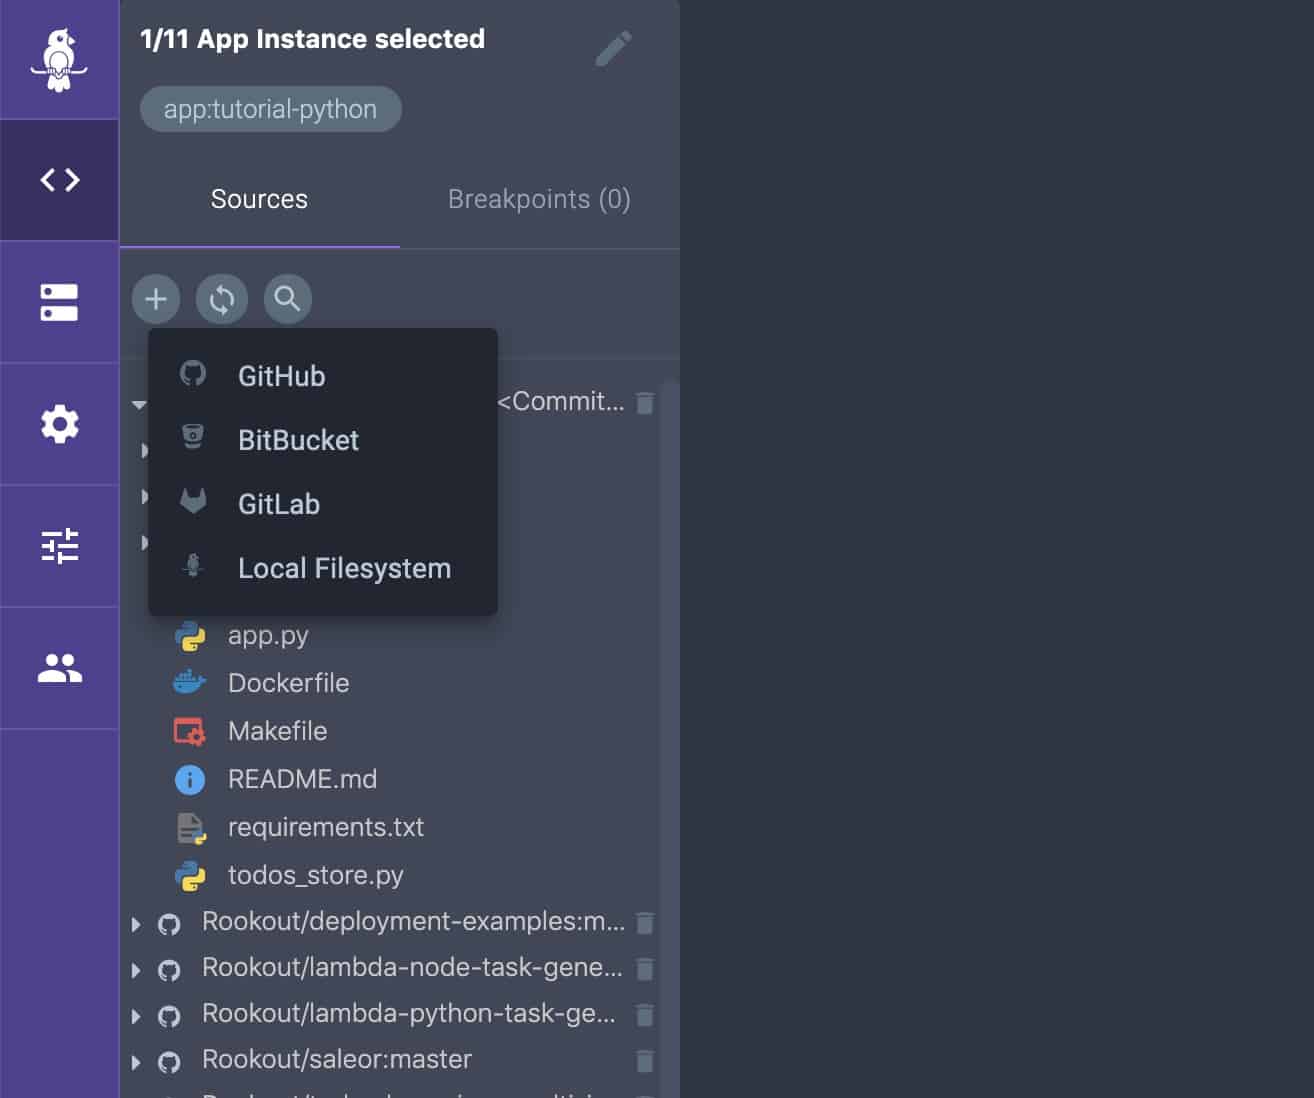
- From here the next step is to connect to your source code repository so that you can set Non-breaking breakpoints, or data collection points, within your running application instance. Rookout can also be integrated into your CI/CD process so that your source code repository can be auto fetched based on the version of your code running in your test or production environment by setting two environment variables:
- ROOKOUT_REMOTE_ORIGIN=<your git URL>
- ROOKOUT_COMMIT=<commit hash of the code running in your environment>
Note that your source code never leaves your network and is never viewable by Rookout:
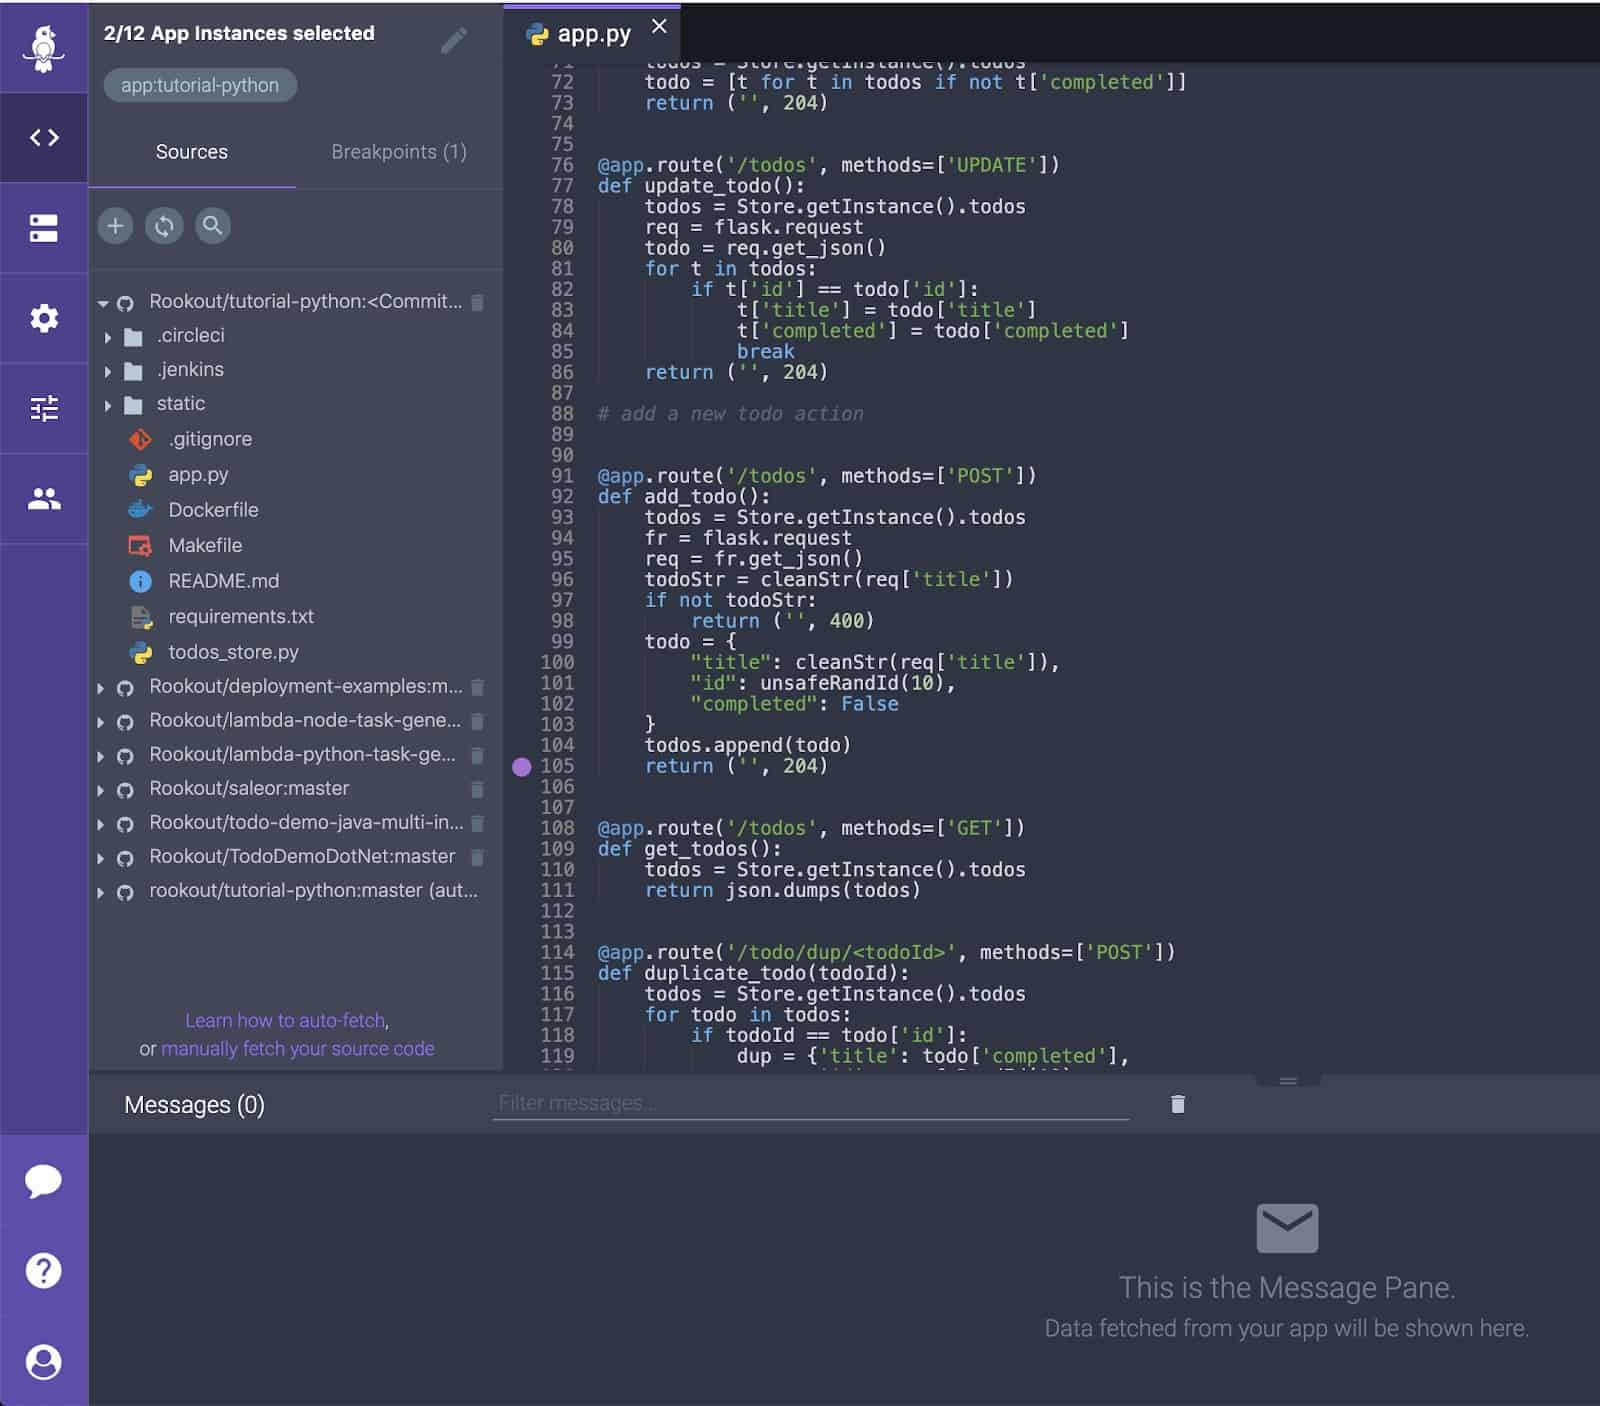
- After connecting the source code repository, a Non-breaking breakpoint can be set within the app.py file to collect data. In this case, the breakpoint is set at line 105 within the add_todo() method which will be invoked every time a new todo item is added to the list.
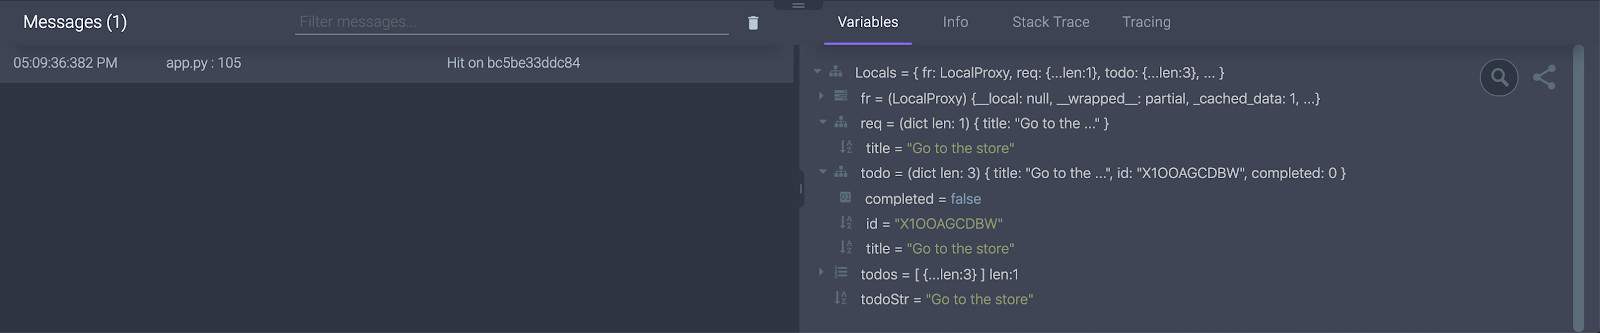
- Finally, we can add a todo item to the list with the todo application and get back a snapshot from the running system including all the local variables, server and process information, a stack trace, and tracing information:
Tying it all Together
And there you have it. We’ve shown how you can dynamically debug a live application running in a Kubernetes cluster just like you would with an application running locally tied to a debugger in an IDE. Just because you’re adopting new and cutting edge technologies that may have their own set of debugging challenges, it doesn’t mean that your development needs to slow down. Adopting new technologies that give deeper insight into what’s happening with running applications while they’re running in their native environments helps to increase developer velocity and improves the mean time to repair (MTTR) of often hard to reproduce issues. This in turn increases the overall understandability and maintainability of mission critical applications.