

Guest post originally published on the New Relic blog by John Watson, lead engineer, and Lavanya Chockalingam, senior product marketing manager at New Relic
As a developer, you care about the performance of your applications, and you know just how challenging it can be to find the right instrumentation to capture telemetry data. One option is to use a proprietary agent, but what if you don’t want to be locked into that agent’s vendor?
You could use one of the open standards like OpenCensus or OpenTracing, but it can be tricky to decide which option is right for your application and workflows. Any option you choose must be able to scale and adapt to your needs as your applications change over time. But it’s also become increasingly important that the instrumentation you choose adheres to standards that can be shared across vendors and projects.
Vendor-neutral open standards matter. And OpenTelemetry, a Cloud Native Computing Foundation (CNCF) project, has created an open specification you can use to standardize how you collect and send telemetry data to backend platforms.
In this post, we’ll explain more about the OpenTelemetry project—how it works, the benefits it offers, and how to get started.
What is OpenTelemetry?
At its inception, OpenTelemetry formed by merging the OpenTracing and OpenCensus projects. OpenTelemetry offers a single set of APIs and libraries that standardize how you collect and transfer telemetry data. OpenTelemetry provides a secure, vendor-neutral specification for instrumentation so that you can send data to distinct backends of your choice, such as New Relic.
The following components make up the OpenTelemetry project:
- Specifications to drive consistency across all projects
- APIs that contain interfaces and implementations based on the specifications
- SDKs (reference implementations of the APIs) created specifically for languages like Java, Python, Go, Erlang, and more
- Exporters that enable you to send data to a backend of your choice
- Collectors that offer a vendor-agnostic implementation for processing and exporting
(We’ll dive more into these components in the architecture section below.)
Key terms
If you’re new to OpenTelemetry, these are the key terms you need to know:
- Traces: A record of activity for a request through a distributed system. A trace is a directed acyclic graph of spans.
- Spans: Named, timed operations representing a single operation within a trace. Spans can be nested to form a trace tree. Each trace contains a root span, which typically describes the end-to-end latency and, optionally, one or more sub-spans for its sub-operations.
- Metrics: A raw measurement about a service, captured at runtime. OpenTelemetry defines three metric instruments: counter, measure, and observer. An observer supports an asynchronous API collecting metric data on demand, once per collection interval.
- Context: A span contains a span context, which is a set of globally unique identifiers that represent the unique request that each span is a part of, representing the data required for moving trace information across service boundaries. OpenTelemetry also supports correlation context which can carry any user defined properties. Correlation context is not required and components may choose not to carry or store this information.
- Context propagation: The means by which context is bundled and transferred between services, typically via HTTP headers. Context propagation is a key part of the OpenTelemetry system, and has some interesting use cases beyond tracing, for example when doing A/B testing. OpenTelemetry supports multiple protocols for context propagation and to avoid issues, it’s important that you use a single method throughout your application. For example, if you use the W3C specification in one service, you need to use it everywhere in your system.
Benefits of OpenTelemetry
By combining OpenTracing and OpenCensus into a single open standard, OpenTelemetry provides the following benefits:
- Simplified choice. You don’t need to decide between one standard or the other. Are you currently using OpenTracing or OpenCensus? Don’t worry, OpenTelemetry offers backward compatibility for both projects.
- Cross-platform. OpenTelemetry supports a variety of languages and backends. It represents a vendor-neutral path to capturing and transmitting telemetry to backends without altering existing instrumentation. This is an important project that satisfies developers looking for this kind of freedom.
- Streamlined observability. As OpenTelemetry puts it, “Effective observability requires high-quality telemetry.” Expect to see more vendors move toward OpenTelemetry, as it’s far easier to accommodate and test against a single standard.
In short, instead of being bogged down in the nitty-gritty of decision making, you can focus your efforts on building amazing, reliable, solutions-based software. And that’s what it’s all about.
Using OpenTelemetry
The OpenTelemetry APIs and SDKs come with plenty of quick-start guides and documentation, so you can learn how to ingest data immediately. The quick-start guide for Java, for example, outlines how to acquire a tracer, create spans, add attributes, and propagate context across the various spans.
You will also find examples of common use cases to help get you started. These provide practical working code that demonstrates how to instrument HTTP/gRPC servers and clients, database connectors, and more.
After you have instrumented your application with OpenTelemetry trace APIs, you can send the trace data to an observability platform like New Relic or any other backend using one of the pre-built exporters in the OpenTelemetry registry.
Specifications for metrics and logs are still in the development phase, but once launched, they’ll play an important role in achieving OpenTelemetry’s main goal: to ensure libraries and frameworks have all built-in telemetry data types, which allows developers to ingest telemetry data without having to instrument it.
OpenTelemetry architecture components
Since OpenTelemetry is intended to be a cross-language framework for vendors and observability backends, it’s extremely flexible and extensible, yet it’s also quite complex. The architecture of a default implementation of OpenTelemetry breaks down into three components:
- The OpenTelemetry API
- The OpenTelemetry SDK, consisting of:
- The Tracer pipeline
- The Meter pipeline
- A shared Context layer
- The Collector

Let’s take a look at each architecture component.
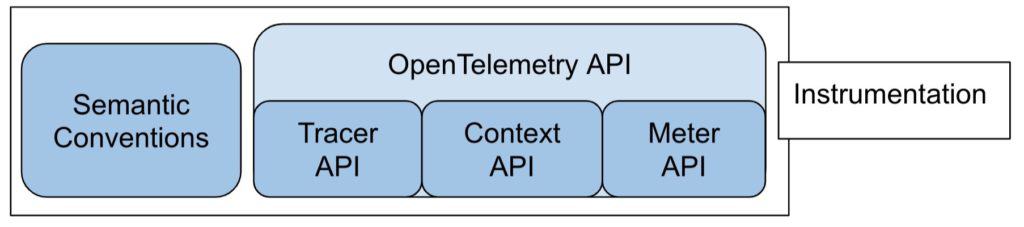
The OpenTelemetry API
Application developers use the Open Telemetry API to instrument their code, and library authors use it to write instrumentation directly into their libraries. The API does not address operational concerns or how data is sent to vendor backends.
We can break the API into four parts:
- A Tracer API
- A Metrics API
- A Context API
- A set of semantic conventions
The Tracer API
The Tracer API supports the generation of spans, which are named, timed operations representing a contiguous segment of work in a trace. Spans can be assigned a traceId and, optionally, be annotated with time-stamped events. A Tracer tags spans with a name and a version. When looking at your data, the name and version associated with a Tracer allow you to track the instrumentation library that generated the spans.
The Metric API
The Metric API provides access to various types of Metric instruments, such as Counters and Observers. Counters allow you to count things. Observers allow you to measure values at discrete points in time; for example, you’d use Observers to “observe” values that aren’t taking place in the context of a Span, such as current CPU load or the total number of bytes free on a disk. See the specification for a list of instruments that cover the full range of possible metric use cases.
The Context API
The Context API adds context information—like W3C Trace Context, Zipkin B3 headers, or New Relic distributed tracing headers—to spans and traces that use the same “context.” In addition, this API allows you to track how spans propagate within a system. The context is updated as a trace propagates from one process to the next. Metric instruments always have access to the current context.
Semantic conventions
Finally, the OpenTelemetry API contains a set of semantic conventions that includes guidelines and rules for naming spans, attributes, and for associating errors with spans (among other things). By encoding this in the API specification, the OpenTelemetry project ensures that all instrumentation, regardless of author or language, contains the same semantic information. This capability is enormously valuable to vendors looking to provide a consistent APM experience for all users.
The OpenTelemetry SDK
Next, the OpenTelemetry SDK is an implementation of the OpenTelemetry API. The SDK consists of roughly three parts, analogous to the APIs we just covered—a Tracer, a Meter, and a shared Context layer that ties it all together.
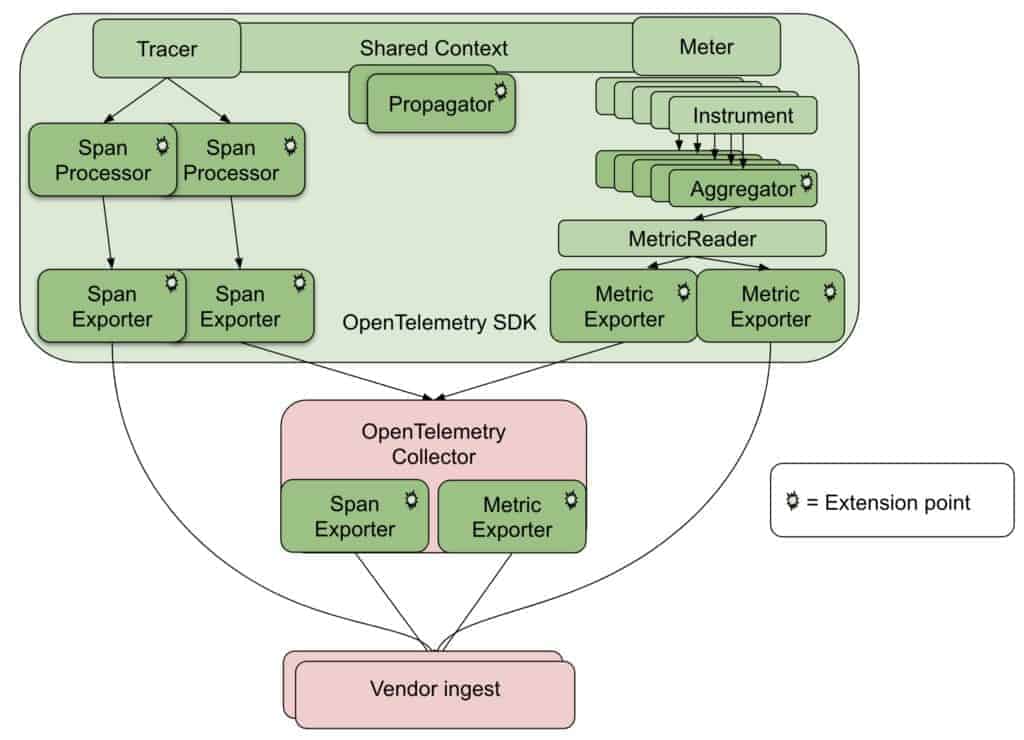
Ideally, the SDK should fulfill 99% of standard use cases, but you can customize the SDK if needed. In the Tracer pipeline implementation, for example, you can customize anything aside from how the core implementation interacts with the shared Context layer. For example, within the implementation of the Tracer pipeline, you can customize the sampling algorithm that it uses.
The Tracer pipeline
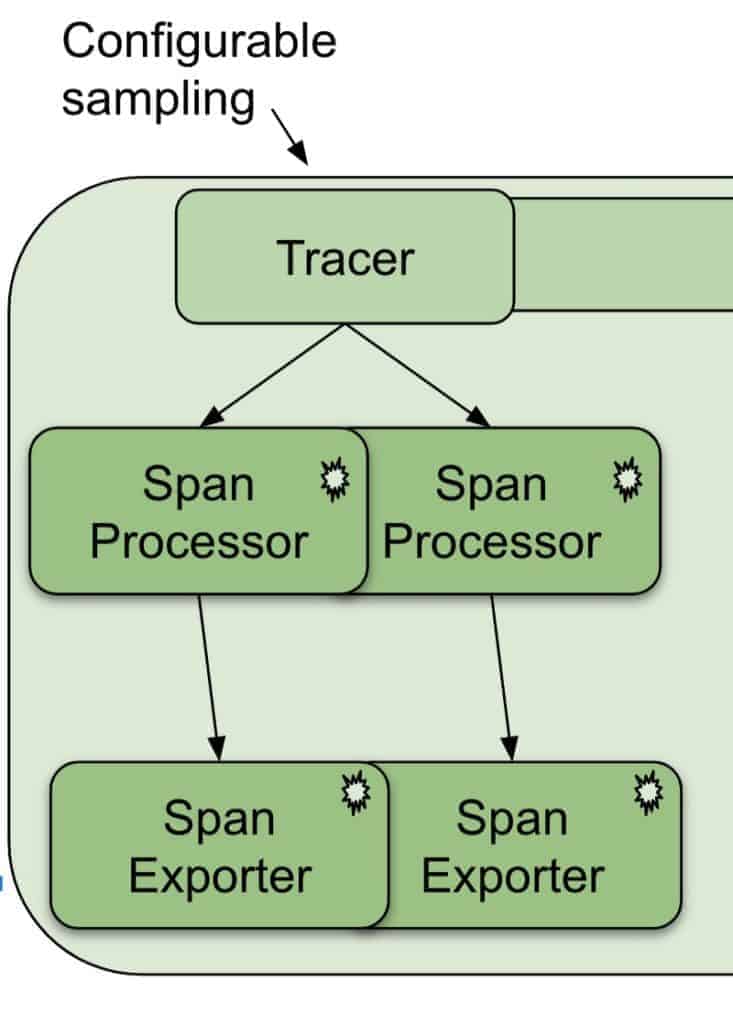
When configuring the SDK, you associate one or more SpanProcessors with the implementation of the Tracer pipeline. A SpanProcessor watches the lifecycle of spans, and delivers spans to a SpanExporter when appropriate. Built into the SDK is a simple SpanProcessor that forwards finished spans directly to the exporter one at a time.
The SDK also contains a batching implementation that forwards finished spans in batches on a configurable interval. However, since the SpanProcessor implementation accepts plug-ins, you can implement your own and assign it custom behavior. For example, if your telemetry backend supports viewing “in progress” spans, you could create a SpanProcessor implementation that sends spans for export at every change to the span state.
At the end of the Tracer pipeline is the SpanExporter. An exporter’s job is simple: convert the spans from their OpenTelemetry representations to whatever the telemetry backend requires and send them to that backend. Providing a custom SpanExporter is the easiest way for a telemetry vendor to participate in the OpenTelemetry ecosystem.
The Meter pipeline
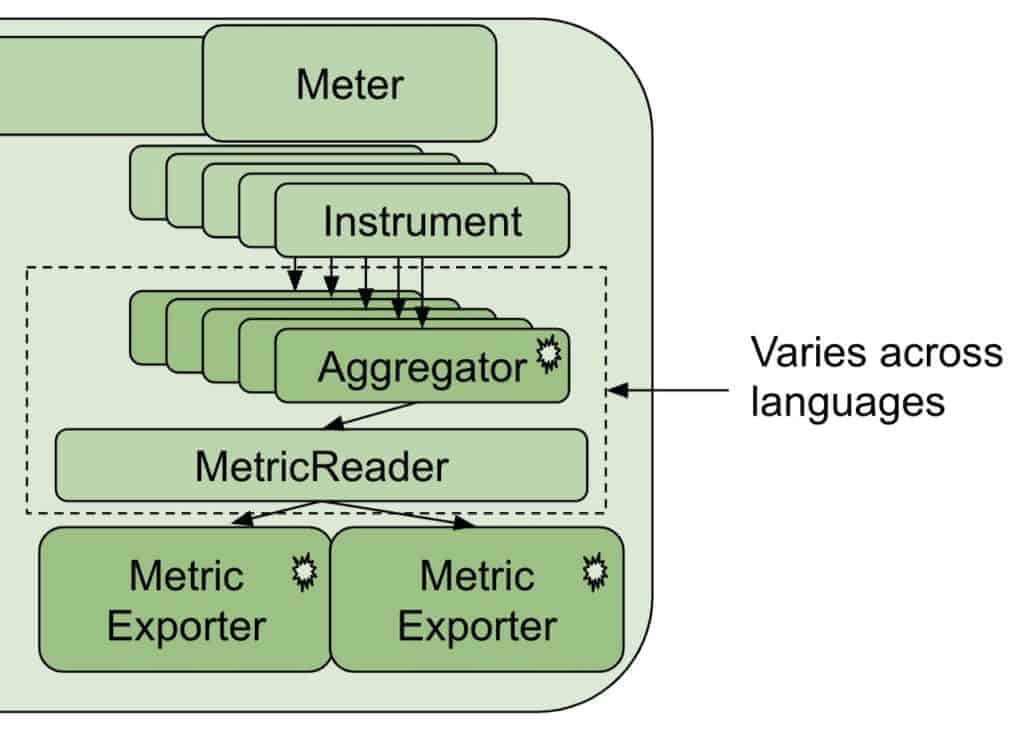
The Meter pipeline is considerably more complex than the Tracer pipeline, as metrics are more complex than spans. The following description is based on the Java implementation of the SDK and may vary across languages.
The Meter pipeline creates and maintains metrics instrumentation of various types, including Counters and Observers. Each instance of an instrument will need to be aggregated in some way. By default, Counters are aggregated by summing the values, and Observers are aggregated by taking the last value recorded. All of the instrument types have a default aggregation defined for them.
(As of this writing, the ability to configure custom aggregations for metrics instrumentation is still in the proposal stage.)
Implementations of the Meter Pipeline currently vary across languages, but in all cases, metric aggregations are delivered to the MetricExporter. Again, as in the case of spans, vendors can provide their own exporter to convert the aggregated data generated by the metric aggregators to the types that are needed for the telemetry backend.
OpenTelemetry supports two styles of exporter: “push”-based exporters, where the exporter sends data to the backend on a timed interval, and “pull”-based exporters, where the backend will query for the data when it wants it. New Relic is an example of a push-based backend, and Prometheus is a pull-based backend.
The shared Context layer
The shared Context layer sits between the Tracer and Meter pipelines and enables all non-observer metric recordings to take place in the context of an executing span. You can customize the Context with propagators, which propagate the span context both in and out of the system. As stated earlier, all OpenTelemetry SDK implementations provide an implementation of the W3C Trace Context specification, but you can optionally include Zipkin B3 propagation, or others.
The Collector
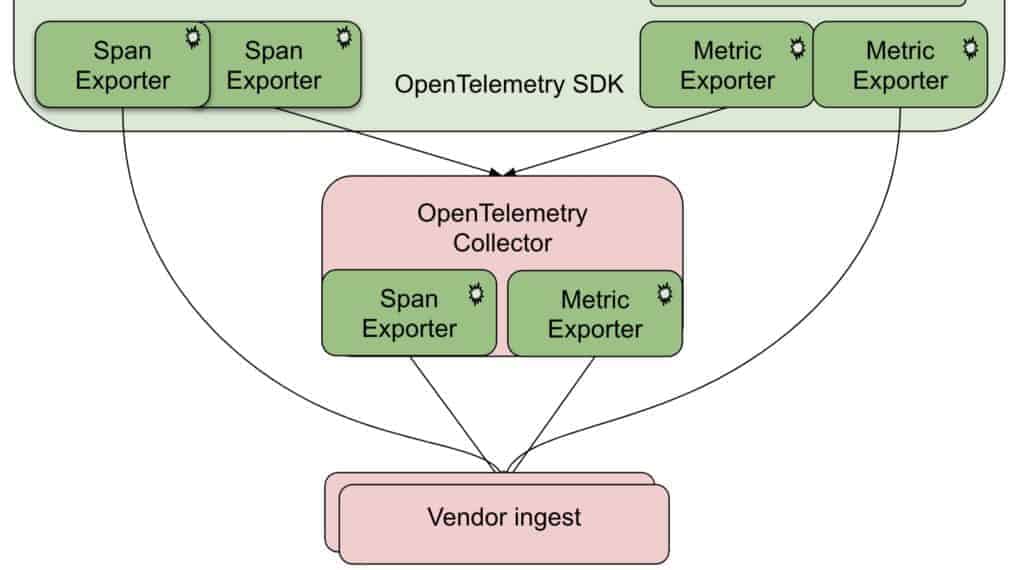
The OpenTelemetry Collector is a stand-alone service that can ingest metrics and spans from various sources, including Zipkin, Jaeger, and OpenCensus. The collector can do tail-based sampling of spans, and enables exporting spans and metrics to a large number of vendor and open-source telemetry systems, including New Relic.
For more information about OpenTelemetry’s architecture, check out the full specification.
Start exploring OpenTelemetry today
Currently, OpenTelemetry is in beta phase. Right now is the ideal time to begin exploring what this project can do for you.
Check out this basic Java example that outlines how you can instrument your code to send metrics and traces to a backend like New Relic.
To find out more about other open source projects New Relic is involved in, visit New Relic Open Source.