
Guest post originally published on the Espagon blog by Ran Ribenzaft, co-founder and CEO at Epsagon
In the second article of our OpenTelemetry series, we’ll focus on best practices for using OpenTelemetry, after covering the OpenTelemetry ecosystem and its components in part 1.
As a reminder, OpenTelemetry is an exciting new observability ecosystem with a number of leading monitoring companies behind it. It is a provider-agnostic observability solution supported by the CNCF and represents the third evolution of open observability after OpenCensus and OpenTracing. OpenTelemetry is a brand new ecosystem and is still in the early stages of development. Because of this, there are not yet many widespread best practices. This article outlines some of the best practices that are currently available and what to consider when using OpenTelemetry. Additionally, it explores the current state of OpenTelemetry and explains the best way to get in touch with the OpenTelemetry community.
OpenTelemetry Best Practices
Just because it’s new doesn’t mean there aren’t some good guidelines to keep in mind when implementing OpenTelemetry. Here below are our top picks.
Keep Initialization Separate from Instrumentation
One of the biggest benefits of OpenTelemetry is that it enables vendor-agnostic instrumentation through its API. This means that all telemetry calls made inside of an application come through the OpenTelemetry API, which is independent of any vendor being used. As you see in Figure 1, you can use the same code for any supported OpenTelemetry provider:
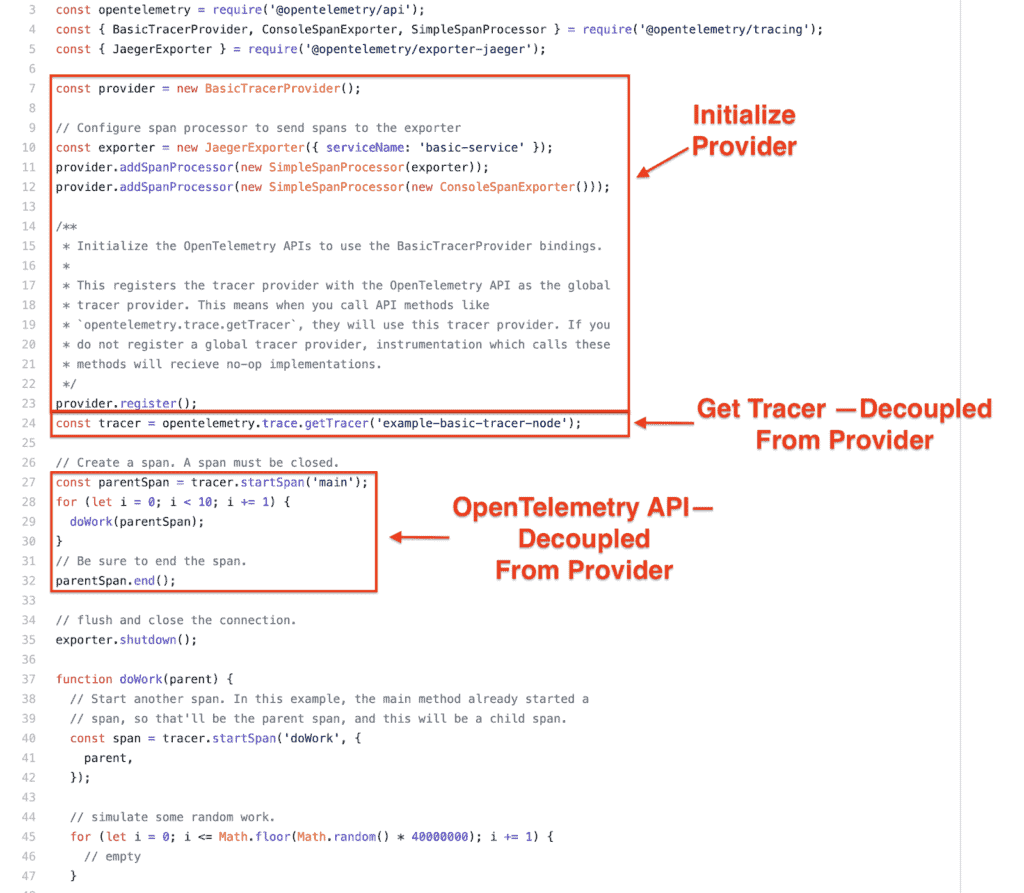
Separation between the vendor provider and instrumentation. (Source: GitHub)
This example shows how exporting is decoupled from instrumentation, so all that’s required of the instrumentation is a call to getTracer. The instrumentation code doesn’t have any knowledge of the providers (exporters) that were registered, only that it can get and use a tracer:
const tracer = opentelemetry.trace.getTracer('example-basic-tracer-node');
An additional best practice for OpenTelemetry here is to keep the provider configuration at the top level of your application or service–usually in the application’s entry point. This ensures that OpenTelemetry instrumentation is separate from the instrumentation calls and allows you to choose the best tracing framework for your use case without having to change any instrumentation code. Separating the provider configuration from the instrumentation enables you to switch a provider simply with a flag or environmental variable.
A CI environment running integration tests may not want to provision jaeger or zipkin or another tracing/metrics provider. This is often meant to reduce costs or complexity by removing moving parts. For example, in local development, the tracer or metrics could be using an in-memory exporter, but production may be using a hosted SaaS. Keeping the initialization of a provider decoupled from instrumentation makes it easy to switch providers depending on your environment; and this in turn allows you to easily switch implementations in case of a vendor switch.
Know the Configuration Knobs
OpenTelemetry tracing supports two strategies to get traces out of an application, a “SimpleSpanProcessor” and a “BatchSpanProcessor.” The SimpleSpanProcessor will submit a span every time a span is finished, but the BatchSpanProcessor buffers spans until a flush event occurs. Flush events can occur when a buffer is filled or when a timeout is reached.
The BatchSpanProcessor has a number of properties:
- Max Queue Size is the maximum number of spans buffered in memory. Any span beyond this will be discarded.
- Schedule Delay is the time between flushes. This ensures that you don’t get into a flush loop during times of heavy traffic.
- Max per batch is the maximum number of spans that will be submitted during each flush.
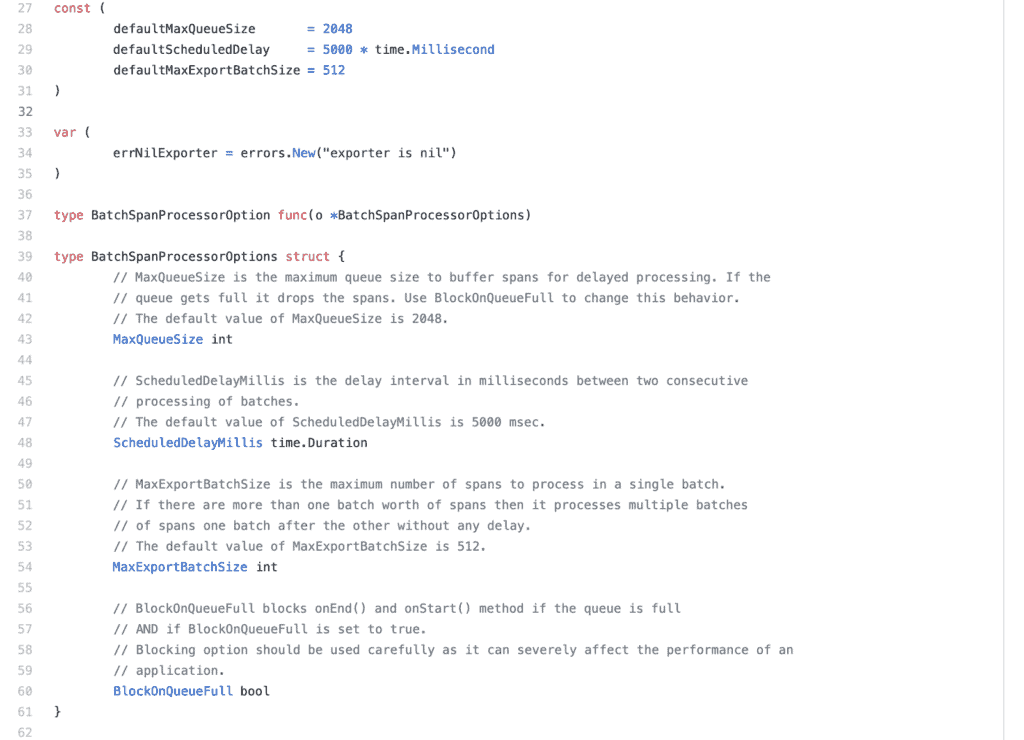
BatchSpanProcessor configuration options. (Source: GitHub)
When the queue is full, the frameworks begin to drop new spans (load shedding), meaning that data loss can occur if these aren’t configured correctly. Without hard limits, the queue could grow indefinitely and affect the application’s performance and memory usage. This is especially important for “on-line” request/reply services but is also necessary for asynchronous services.
Look For Examples… and Sometimes Tests
OpenTelemetry is still a very young project. This means the documentation for most of the libraries is still sparse. To illustrate this, for the BatchSpanProcessor discussed above, configuration options are not even documented in the Go OpenTelemetry SDK! The only way to find examples is by searching the code:
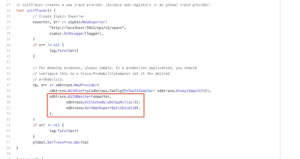
BatchSpanProcessor configuration usage. (Source: GitHub)
Since the project is still in active development and the focus is on features and implementation, this makes sense. So, if you need answers, go to the source code!
Use Auto-Instrumentation by Default… but Be Careful of Performance Overhead
OpenTelemetry supports auto-tracing for Java, Ruby, Python, JavaScript, and PHP. Auto-tracing will automatically capture traces and metrics for built-in libraries such as:
- HTTP Clients
- HTTP Servers & Frameworks
- Database Clients (Redis, MySQL, Postgres, etc.)
Auto-instrumentation significantly decreases the barrier to adopting observability, but you need to monitor it closely because it adds additional overhead to program execution.
During a normal execution, the program calls out directly to the HTTP client or database driver. Auto-instrumentation wraps these functions with additional functionality that costs time and resources in terms of memory and CPU. Because of this, it’s important to benchmark your application with auto-tracing enabled vs. auto-tracing disabled to verify that the performance is acceptable.
Unit Test Tracing Using Memory Span Exporters
Most of the time, unit testing focuses on program logic and ignores telemetry. But occasionally, it is useful to verify the correct metadata is present, including tags, metric counts, and trace metadata. A mock or stub implementation that records calls is necessary to achieve this.
Most languages don’t document usage of these constructs, so remember that the best place to find examples of usage is in the actual OpenTelemetry unit tests for each project!
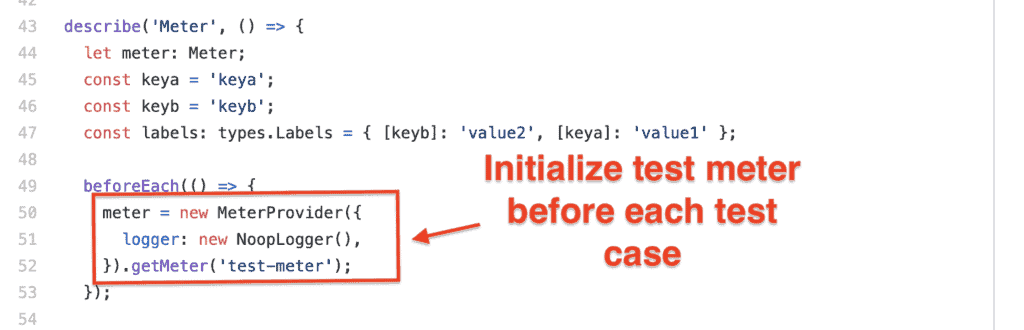
Initializing meter in a unit test. (Source: GitHub)
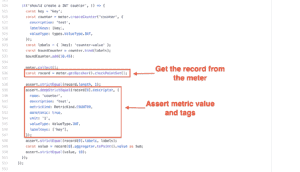
Using a metric meter in a unit test. (Source: GitHub)
Tests are able to configure their own test exporter (“meter” in Figure 4 above). Remember that OpenTelemetry separates instrumentation from exporting, which allows the production code to use a separate exporter from testing. The example in Figure 5 shows a test configuring its own “meter,” making calls to it, and then making assertions on the resulting metric. This allows you to test that your code is setting metrics and metric tags correctly.
Customization & Beta Versions
OpenTelemtry officially reached its beta phase on March 30, 2020! Since the project is still young, each language has different levels of support, documentation, examples, and exporters available. So, make sure to check before assuming support for a specific provider.
The best place to find information is in the language-specific repo in GitHub under the OpenTelemetry organization or in the language-specific Gitter channel. The official OpenTelemetry project page is another good source of information.
Feedback!
OpenTelemetry has a very active community on Gitter, with a global channel available at open-telemetry/community. Each language has its own Gitter channel as well, and there are tons of opportunities to contribute, especially to documentation and exporters. Since OpenTelemetry is young, even the specification is still in active development, so this is a great time to give feedback and get involved in OpenTelemetry.
Conclusion
OpenTelemetry has recently reached beta and is available for use. It’s important to remember that the libraries and ecosystem here are still very young. Make sure to consider these OpenTelemetry best practices and dig for documentation in tests and examples:
- Keep instrumentation separate from exporting.
- Know what OpenTelemetry is doing under the hood.
- Look for tests as documentation.
Also, if you ever run into issues, the OpenTelemetry community is very helpful and easily accessible through Gitter.