


Originally published on the Epsagon blog by Ran Ribenzaft, co-founder and CTO at Epsagon
In this post, we talk about two of the most popular open-source monitoring solutions available today: Prometheus and Grafana.
Monitoring is a crucial feature for any successful company in a disputed market. It allows companies to understand application and user behavior quickly, identify bugs, and scale an application due to usage as needed. Due to the increasing number of services running in a distributed manner, observability tools have become important for dev (and DevOps) teams as systems became too hard to be monitored manually.
The Perfect Combo: Prometheus and Grafana
Prometheus and Grafana can be used as complementary services that, together, provide a robust time-series database with excellent data visualization. Let’s first take a look at both individually.
Prometheus
Designed by SoundCloud to be an open-source monitoring and alerting system, Prometheus is a real-time, time-series database with a robust query language designed to provide aggregate insights from data series while they are collected.
The Prometheus server is where the data is stored, with many nodes to scale the influx of data “received.” Applications don’t send data to Prometheus; it is Prometheus that pulls data from the monitored systems. Of course, not all apps are well suited for a pull scheme, so it is possible to create a push gateway to serve as an intermediate service. The push service can also be used for a short-lived process like a serverless application, which is created and destroyed too fast to be discovered by the server without having its data pushed.
Each Prometheus Server is stand-alone and does not depend on other services, such as network storage or remote services. The server was designed to be the last system standing as a reliable tool when everything else is burning.
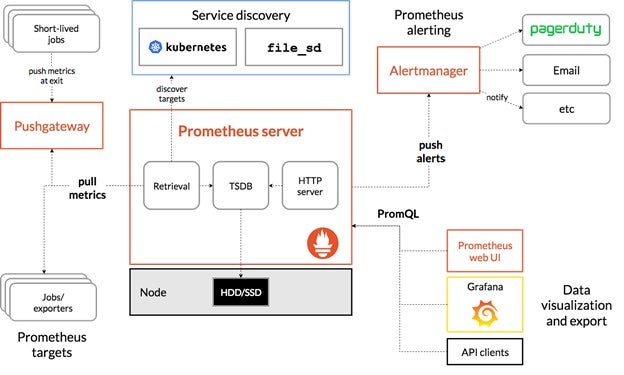
Prometheus also has a separate module called Alertmanager that is used to customize and call alerts within the application.
Finally, Prometheus provides a powerful, declarative, query language called PromQL. Below, this language is used to show all HTTP Requests that returned a status code starting with 4 (source):
- http_requests_total{status!~“4..”}
And here, you can return a 5-minute rate for the past 30 minutes, with a 1-minute resolution.
- rate(http_requests_total[5m])[30m:1m]
As a time-series database, Prometheus only stores times and numbers so that it can fully optimize the data stored. As an example, imagine the following sequence of numbers:
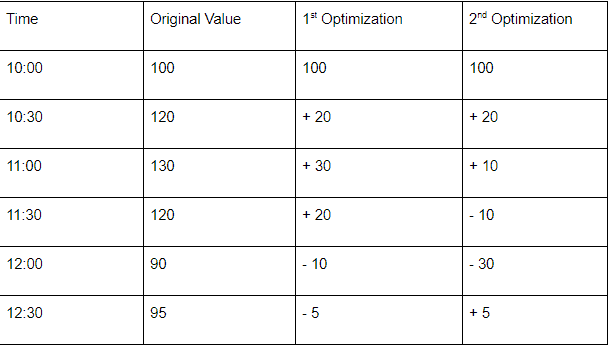
Without optimization, the time series will store the full value for every measured time. The first optimization shows an algorithm that annotates the first value and calculates the delta based on the first value. On the second optimization, it interprets the delta based on the previous value. There are lots of strategies to optimize storage on Prometheus.
Prometheus also has a robust alerting system called alert manager that is configured by command-line flags or configuration files. It’s a simple text-based solution that can be integrated via email, Slack, and other services.
Grafana
While Prometheus is all about how to store and query data, Grafana is about how to visualize this data so it is possible to identify issues quickly. Grafana describes itself as an “open-source metrics analytics & visualization suite.” It supports not only Prometheus but also Elasticsearch, InfluxDB, and many others.
Grafana works as a sandbox for graphic visualization, where you can create themed dashboards with several graphics by collecting data from different data sources and metrics. The definition of each dashboard varies from the data source, and, in the case of Prometheus, PromQL should be used to describe how the data is going to be presented on Grafana. There are lots of examples of official documentation for further information.
Grafana also supports alerting with more integrated solutions than Prometheus (including Kafka Topics, Google Hangouts, Telegram, and others). Each one has some advantages:
- With Prometheus, you can share alerts in template files, hence it is easy to scale alarms for as many hosts as you have.
- Grafana has an excellent user interface for creating alerts and more services to notify. However, it can be tricky to create several similar alerts, as there is no template.
Prometheus and Grafana Use Cases
In this section, we present the two most common use cases for using Prometheus and Grafana together. Although there are many other relevant use cases, we chose to illustrate two trending technologies.
Microservices
Microservices is an architectural design that dictates how application logic should be distributed in many self-deployed units. Usually, people separate (micro)services by business logic: Payment Service, Chart Service, User Service, etc. Microservices are evenly distributed and may have more than one instance per service depending on service usage. Since each service is self-deployed, each one can have its proper version and be deployed by different teams.
All those features make it hard to be discovered by a monitoring system. The services are created and destroyed on-demand automatically, they can be upgraded many times in a day, and more than one version can be live at the same time for A/B tests or rolling updates. A monitoring platform should locate all services automatically–it is impossible to classify and discover each service manually as services are created and destroyed several times.
Prometheus has a solution embedded in its configuration file, which makes it possible to dynamically find new services and virtual machines from major cloud providers and service discovery applications (such as Consul).
Kubernetes
Kubernetes is a container orchestrator, meaning it manages several applications that run on different machines and share resources between them, such as network and storage. Many microservices platforms are deployed using Kubernetes, which can be monitored via numerous ways. In the case of Prometheus, there is a configuration property to detect services going up or down dynamically as well as nodes (machines) that are turned on and off during the operation.
Alternatives for Prometheus and Grafana
There are many alternatives to the combination of Prometheus and Grafana. We selected three accessible and open-source solutions for monitoring.
InfluxDB
InfluxDB is also a time-series database that has Grafana integration. Its main difference is that it works applications by actively pushing data to the service (while Prometheus pulls data from every service). InfluxDB also allows data to be pushed to history so it can be used for more than monitoring, while Prometheus only enables data to be appended at the end of the time series. Moreover, InfluxDB supports many different data types, while Prometheus only supports float data and Strings with limited functionality.
InfluxDB may be more suitable if you are doing event logging (as it allows adding data in the middle of a time-series and different data types). Prometheus is more suitable for metric monitoring, as it has better performance and reliability.
Graphite
Graphite is another time-series database with some fundamental differences when compared to Prometheus.
Graphite also provides graphics, so you don’t have to integrate with a third-party solution (while Prometheus relies on Grafana). They are very equivalent in terms of how data is stored, the difference here being the storage format: While the Graphite database expects data to input at regular intervals, Prometheus is more flexible and allows different time intervals.
ELK
ELK Stack is not a time-series database. In reality, it’s a combination of ElasticSearch, LogStash, and Kibana. It allows you to store logging data from many applications into a centralized and highly indexed repository that can be queried in near real-time. It doesn’t provide the same reliability as Prometheus but can be seen as a complimentary service. It allows analysis of logs to detect issues and can help map differences in A/B tests or how a rolling update is going.
Deploying and Using Prometheus and Grafana
Prometheus and Grafana are both open-source solutions that can be installed anywhere, but without support.
Prometheus provides Docker images and configuration management systems (Ansible, Chef, Puppet, or SaltStack) plugins, so it should be easy to set up a simple instance. Things get harder if you need more reliability and deploy more than one instance as well as use remote storages (see federation for more details).
There is also the cost of maintenance. Security and bug fixes are released every month and should be deployed as soon as possible in your environment (see Prometheus changelog).
Grafana also has some manual steps to be installed, primarily if you choose not to use the official Docker image. After installation, your Prometheus instance should be configured as a Grafana data source. And there is a manual step for setting the right Prometheus address and port into the Grafana dashboard.
Grafana’s changelog has a high number of releases per month, which means you should be aware of any version change and upgrade your on-premises services.
The cost to keep these services up and safe are high: You have to have people dedicated to keep Prometheus and Grafana stable, search for security issues that were solved by the application and, of course, maintain backups and CPU capacity so that everyone using the system can do so without slowdowns.
However, what’s your primary objective? To keep a monitoring system online every time? You should not use your resources to maintain something that is not your core business. Besides on-promises solutions, some hosted solutions keep everything up-to-date and with quality guarantees ensuring that everything will be up almost all the time.
Epsagon leverages the power of Prometheus without needing to keep it up. It manages and keeps everything updated so that you can focus on your core business. It also offers more than the core Prometheus/Grafana combo provides, such as distributed tracing and seamless integration with many different platforms–from serverless functions to high-value databases. It also manages the cloud provider’s services without complex configuration.
Conclusion
In this post, we gave an overview of what Prometheus and Grafana are and why they are so powerful. We also discussed some alternatives and finally compared on-premises vs. SaaS solutions.
Prometheus and Grafana is a software combo that is gaining traction, mostly because they are simple to use and very effective. There are other open-source alternatives, but most of these have a different main objective. For example, ELK stack is excellent, however, it is focused on storing logs, indexing all data stored, and extracting information from it. Prometheus, on the other hand, focuses on very simple numeric time-series, which translates into faster response time and reliability.
Since Prometheus and Grafana are gaining in popularity, there are very good SaaS solutions available as well, such as Epsagon to help you manage it all.