
Guest post originally published on Epsagon by Ran Ribenzaft
When it comes to debugging a Kubernetes application, it’s usually a painful process, full of unknowns and unpredictable side effects. What happens when your Kubernetes cluster is not healing itself? How can misconfigured Resource Limits impact your application running on production? Dealing with such issues often makes debugging Kubernetes an overwhelming process if you don’t follow some basic principles.
In The Art of Software Testing, Second Edition, the authors state that “The principles are psychological in nature, intuitively obvious, yet they are often forgotten or overlooked.” How often have you struggled with finding the root cause of a problem because you simply weren’t using the right approach; and, in the end, the answer was so obvious?
When it comes to troubleshooting and debugging, the process stays the same, no matter if it’s an application running on Kubernetes or a bare VM. And by being aware of some key guidelines and possible problems from the get-go, you can help make the debugging process far less painful.
This article provides some generic troubleshooting and debugging techniques for an application running in a Kubernetes environment and also covers the most common issues you can expect.
3 easy ways to ease the pain
A lot of the time we forget the simple tricks at our disposal that can help make our work far more efficient and less of a headache. Here are three for such tricks troubleshooting.
Focus on the root cause
During the debugging process, it’s easy to get trapped and start overlooking the actual problem. So make sure that you focus on the root cause of any issue, and read error messages carefully! When something didn’t work as expected, it used to be common to try many different approaches that had nothing to do with actual troubleshooting. For example, you would continuously re-create a Pod or change a random line of code, believing that this would fix the problem.
But debugging is a problem-solving process. So first, you have to think and find the root cause by understanding why the particular problem occurred, for example, by looking at Kubernetes events or application logs carefully.
Ask for help
It’s not shameful to Google an issue, look at StackOverflow for similar problems, and reach out to others. It’s very likely that someone else has had the same issue as you; so take advantage of that!
For Kubernetes-specific issues it’s worth it to:
- Join the Kubernetes Slack channel.
- Look at Kubernetes GitHub repository issues.
- Be part of the Kubernetes community.
Take a break
It might sound obvious, but it is very important to be aware of your capacity and for how long you can maintain a good level of focus. If you cannot locate an error in a reasonable amount of time, drop it for a while and work on something else.
5 things that can go wrong with your Kubernetes deployment
In the previous section, we discussed some generic principles when dealing with debugging. Now, let’s have a look at what can go wrong when using Kubernetes, what are the common issues, and how to identify them.
Incorrect resource limits
When your resource limits are set too high and a Kubernetes cluster doesn’t have enough capacity in terms of resources, then the application can’t be scheduled on the node. This means that it will stay in Pending phase and not be visible when running kubectl get pods; so, you have to take a look at Kubernetes events instead.
When exceeding memory resource limits, Kubernetes will terminate the Pod due to OOM (Out of memory) error. Exceeding CPU resource limits throttles the container process at the operating system level, and it never gets evicted.
Failing liveness and readiness probes
A liveness probe is a part of the self-healing mechanism in Kubernetes. If your liveness probe is failing for some reason, Kubernetes will not restart your Pod until it becomes healthy.
A readiness probe determines when your application is ready to serve traffic, which means that your Kubernetes Service will not forward any traffic to that application until, again, the probe is healthy.
Networking issues
Nowadays, when using a managed Kubernetes cluster, container networking (CNI) is monitored and maintained by a cloud provider. But that doesn’t mean that there won’t be any problems.
On the other hand, an improperly configured Network Security Policy and/or Ingress can cause connectivity problems from/to your application.
Role-Based Access Control (RBAC) issues
When RBAC is enabled in Kubernetes, your application needs to use a Service Account with fine-grained roles assigned. But sometimes these permissions might not be enough, causing problems with the application itself.
Misconfigured, constrained pod security policies
When your application requires some special permissions, such as access to the host volume or networking, Pod Security Policy comes into play. Improperly configured policies mean that your application cannot start.
Kubernetes native solutions
In this section, we will focus on Kubernetes’ built-in mechanisms that can help us with debugging your application.
Kubernetes events
Kubernetes events indicate any changes and errors in the state of Kubernetes resources. These would include exceeded resource quotas or pending Pods due to misconfigured RBAC roles as well as any other informational messages. As an example, let’s take a look at the “Kubernetes keeps failing at mounting a volume #29166” issue with the following Kubernetes event:
Warning FailedSync Error syncing pod, skipping: timeout expired waiting for volumes to attach/mount for pod "cinder-init-jrryr"/"default". list of unattached/unmounted volumes=[default-token-ea2n7]
As you can see in the example above, the Kubernetes event indicates an issue with the Pod’s volume attach/mount due to the timeout.
In order to get Kubernetes events from the specific namespace, run:
kubectl get events --namespace <namespace-name> --sort-by='{.lastTimestamp}'
Debugging pods and containers
Container logs
The most obvious way of debugging a container log is via a logging mechanism. In Kubernetes, every container usually writes to the standard output (stdout) and standard error (stderr) streams unless something other than the default logging approach has been configured, e.g. save to .log file.
Application logs can be retrieved using:
kubectl -n logs <pod-name>
kubectl -n logs <pod-name>  --container <container-name>.
For more kubectl log examples, please take a look at this cheat sheet.
However, when a Pod is terminated or evicted from the node, all corresponding log files are gone. In order to avoid such a loss, you need to keep a log’s storage separate from your Kubernetes application lifecycle. Here’s an example of centralized logging with ELK stack.
Pod phases
The lifecycle of a Pod consists of five phases, as described below:
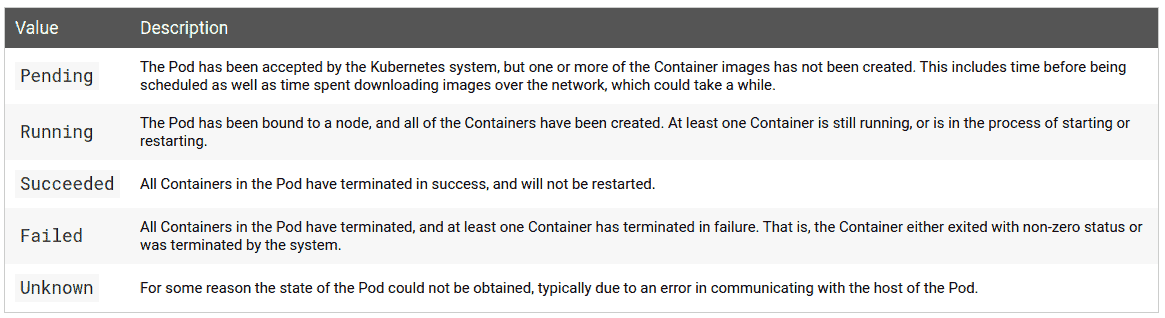
When you run the following commands, you can see the actual phase and status of the Pod:
kubectl describe pod <pod-name>
kubectl describe pod <pod-name>  -o wide
kubectl describe pod <pod-name>  -o yaml
When your container is constantly crashing, it’s worth it to determine the reason for pod failure based on the termination exit code form the status section.
Also, when the Pod phase is Pending, it means that your application couldn’t start due to some problem, for example, lack of permissions (RBAC roles) or exceeding resource limits. In this case, it’s worth taking a look at Kubernetes events:
kubectl get events --namespace <namespace-name> --sort-by='{.lastTimestamp}'
Liveness and readiness probes
are key ingredients for high-availability and self-healing in Kubernetes. When the liveness probe fails, your Pod won’t be in Running phase, and Kubernetes will be restarting it. You can check this by running the following command:
kubectl describe pod <pod-name>
In some cases, your application will take longer than usual to restart due to various issues, such as an initial data indexing process that can cause liveness and readiness probes to fail. In this situation, you have to adjust the liveness and readiness thresholds according to your application’s startup time.
Resource limits and quotas
According to good practices, resource limits should be specified to help the Kubernetes scheduler determine if your application fits on a specific node.
In more resource-constrained Kubernetes environments, cluster operators are used to configure resource quotas for CPU, memory, and other Kubernetes resources, such as volumes or the number of Pods allowed at the cluster/namespace level.
This setup can cause some problems when your application doesn’t meet the resource requirements. The easiest way to find out if there’s an issue here is to take a look at Kubernetes events:
kubectl get events --sort-by='{.lastTimestamp}'
Error from server (Forbidden): error when creating "examples/admin/resource/quota-mem-cpu-pod-2.yaml":
pods "quota-mem-cpu-demo-2" is forbidden: exceeded quota: mem-cpu-demo,
requested: requests.memory=700Mi,used: requests.memory=600Mi, limited: requests.memory=1Gi
As you can see in the example above, the Pod has a memory request of 700 MiB. But when the new memory request is added to the used memory request, the total is more than the memory namespace resource quota; and this prevented the Pod to be run.
If you want to monitor resource quota usage at the namespace/cluster level, you can run the following commands:
kubectl describe quota
kubectl describe quota --namespace <namespace-name>
Getting a shell to a running container
Another interesting way of troubleshooting is based on executing directly into the container and getting a shell using the kubectl exec command.
kubectl run exec-test-nginx --image=nginx
kubectl exec -it exec-test-nginx-6558988d5-fgxgg -- sh
$ ps -ef |grep kubectl
501  8507 8409   0 7:19PM ttys000    0:00.13 kubectl exec -it exec-test-nginx-6558988d5-fgxgg -- sh
Once you are in, you can debug the actual application in the same way that you do on your local environment. Note that the Pod has to be in the Running phase in order to do that, which means that you cannot exec into a crashing container.
You can learn more about how kubectl exec works under the hood in this article.
Sidecars and shared process namespace
In a scenario where you create a Pod that runs two containers, the containers can then share volume and network and use these to communicate.
According to the Container Design Patterns for Kubernetes, “The sidecar container extends and works with the primary container. This pattern is best used when there is a clear difference between a primary container and any secondary tasks that need to be done for it.”
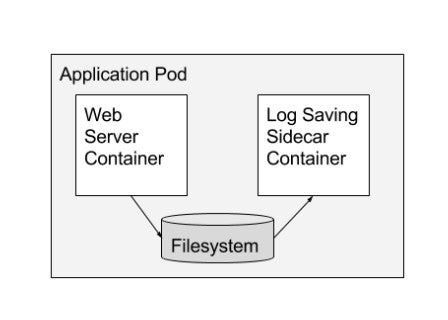
The Pod manifest below shows a simple sidecar pattern:
apiVersion: v1
kind: Pod
metadata:
  name: pod-with-sidecar
spec:
  volumes:
  - name: shared-logs
    emptyDir: {}
  containers:
  - name: app-container
    image: alpine
    command: ["/bin/sh"]
    args: ["-c", "while true; do date >> /var/log/app.txt; sleep 1;done"]
    volumeMounts:
    - name: shared-logs
      mountPath: /var/log
  - name: sidecar-container
    image: alpine
    volumeMounts:
    - name: shared-logs
      mountPath: /var/log/app-logs
How does this help with debugging? Well, having a shared storage and network where you can communicate using a localhost loopback gives you a lot of possibilities to monitor and troubleshoot your application from another container-even when your main application container is crashing!
If your application is running as Deployment, you can simply add a sidecar container using the following command:
kubectl edit <deployment-name>
Once it’s done, you can get the shell to a running sidecar container as mentioned in the section above.
Debugging networking
Troubleshooting and debugging Kubernetes networking issues is hard. It requires a good understanding of OSI layers, software-defined networks, and operating systems, as well as cloud provider specific networking.
Kubernetes supports multiple Container Network Interfaces (CNI), where each one works slightly differently. For example, Flannel leverages a VxLAN overlay network, where IP packets are encapsulated over UDP. On the other hand, Cilium is based on a low-level Linux kernel technology called BPF. As you can see, depending on what CNI implementation you use, the debugging process might be completely different.
Let’s have a look at some common networking issues in Kubernetes below.
Firewall rules block network traffic
If a container cannot communicate to the external world with other services running in the same Kubernetes cluster, we need to exec into the container and verify external connectivity by running a simple ping command from the container:
kubectl exec <pod-name>
$ ping google.com
PING google.com (216.58.215.110) 56(84) bytes of data.
64 bytes from waw02s17-in-f14.1e100.net (216.58.215.110): icmp_seq=1 ttl=53 time=19.0 ms
64 bytes from waw02s17-in-f14.1e100.net (216.58.215.110): icmp_seq=2 ttl=53 time=21.8 ms
^C
--- google.com ping statistics ---
2 packets transmitted, 2 received, 0% packet loss, time 1002ms
rtt min/avg/max/mdev = 19.085/20.466/21.847/1.381 ms
Also, you can look at iperf if you want to use different network protocols:
#  on the server side container
iperf -s -p 8081 -u
# on the client side container
iperf -c 172.28.128.123 -u -p 8081 -b 1K
For further details, take a look at Kubernetes Network Benchmarking with iperf.
Kubernetes service not working
Before we start with debugging Service’s endpoint, we have to make sure that the Service name can be resolved by DNS. In order to do that, you can exec into Pod and run:
nslookup <service-name>
Address 1: 10.0.0.12 kube-dns.kube-system.svc.cluster.local
When your Kubernetes Service spec.selector section is not properly defined, it can be a common problem that the endpoints section is empty. Make sure that your Pods are targeted by the Service by running:
kubectl get endpoints <service-name>
NAME        ENDPOINTS
hostnames   10.244.0.5:9376,10.244.0.6:9376,10.244.0.7:9376
For more information, take a look at Debug Services.
Network policies block traffic between Kubernetes namespaces
When your containers can’t communicate between Kubernetes namespaces, it might be caused by Network Policy blocking the traffic.
The Network Policy below selects all Pods but does not allow any ingress traffic to those Pods:
apiVersion: networking.k8s.io/v1
kind: NetworkPolicy
metadata:
  name: default-deny
spec:
  podSelector: {}
  policyTypes:
  - Ingress
You can review all of your policies by running:
kubectl describe networkpolicy -o yaml --all-namespaces
Summary
In this article, we’ve reviewed some troubleshooting and debugging techniques for an application running on a Kubernetes cluster. Of course, it can be hard to predict and cover most of the problems in such a dynamic environment such as Kubernetes. In most cases, there can still be some surprises. But hopefully, after reading this article, you have a better idea of what to expect and the overall process to remediate the most common issues.