

Originally posted on Prometheus.io.
Continuing our series of interviews with users of Prometheus, Donatas Abraitis from Hostinger talks about their monitoring journey. For more on Prometheus, consider attending KubeCon + CloudNativeCon EU in Barcelona from May 20-23.
Can you tell us about yourself and what Hostinger does?
I’m Donatas Abraitis, a systems engineer at Hostinger. Hostinger is a hosting company as the name implies. We have around 30 million clients since 2004 including the 000webhost.com project – free web hosting provider.
What was your pre-Prometheus monitoring experience?
When Hostinger was quite a small company, only Nagios, Cacti, and Ganglia existed at that time in the market as open source monitoring tools. This is like telling young people what a floppy drive is, but Nagios and Cacti are still in development cycle today.
Even though no automation tools existed. Bash + Perl did the job. If you want to scale your team and yourself, automation should never be ignored. No automation – more human manual work involved.
At that time there were around 150 physical servers. To compare, till this day we have around 2000 servers including VMs and physical boxes.
For networking gear, SNMP is still widely used. With the rise of “white box” switches SNMP becomes less necessary, as regular tools can be installed.
Instead of SNMP, you can run node_exporter, or any other exporter inside the switch to expose whatever metrics you need with the human-readable format. Beautiful is better than ugly, right?
We use CumulusOS which is in our case mostly x86 thus there is absolutely no problem to run any kind of Linux stuff.
Why did you decide to look at Prometheus?
In 2015 when we started automating everything that could be automated, we introduced Prometheus to the ecosystem. In the beginning we had a single monitoring box where Alertmanager, Pushgateway, Grafana, Graylog, and rsyslogd were running.
We also evaluated TICK (Telegraf/InfluxDB/Chronograf/Kapacitor) stack as well, but we were not happy with them because of limited functionality at that time and Prometheus looked in many ways simpler and more mature to implement.
How did you transition?
During the transition period from the old monitoring stack (NCG – Nagios/Cacti/Ganglia) we used both systems and finally, we rely only on Prometheus.
We have about 25 community metric exporters + some custom written like lxc_exporter in our fleet. Mostly we expose custom business-related metrics using textfile collector.
What improvements have you seen since switching?
The new setup improved our time resolution from 5 minutes to 15 seconds, which allows us to have fine-grained and quite deep analysis. Even Mean Time To Detect(MTTD) was reduced by a factor of 4.
What do you think the future holds for Hostinger and Prometheus?
As we have grown our infrastructure N times since 2015 the main bottleneck became Prometheus and Alertmanager. Our Prometheus eats about ~2TB of disk space. Hence, if we restart or change the node under the maintenance we miss monitoring data for a while. Currently we run Prometheus version 2.4.2, but in the near future we have a plan to upgrade to 2.6. Especially we are interested in performance and WAL related stuff features. Prometheus restart takes about 10-15 minutes. Not acceptable. Another problem is that if a single location is down we miss monitoring data as well. Thus we decided by implementing highly available monitoring infrastructure: two Prometheus nodes, two Alertmanagers in separate continents.
Our main visualization tool is Grafana. It’s critically important that Grafana could query the backup Prometheus node if the primary is down. This is easy as that – put HAProxy in front and accept connections locally.
Another problem: how can we prevent users (developers and other internal staff) from abusing dashboards overloading Prometheus nodes.
Or the backup node if the primary is down – thundering herds problem.
To achieve the desired state we gave a chance for Trickster. This speeds-up dashboard loading time incredible. It caches time series. In our case cache sits in memory, but there are more choices where to store. Even when the primary goes down and you refresh the dashboard, Trickster won’t query the second node for the time series which it has in memory cached. Trickster sits between Grafana and Prometheus. It just talks with Prometheus API.
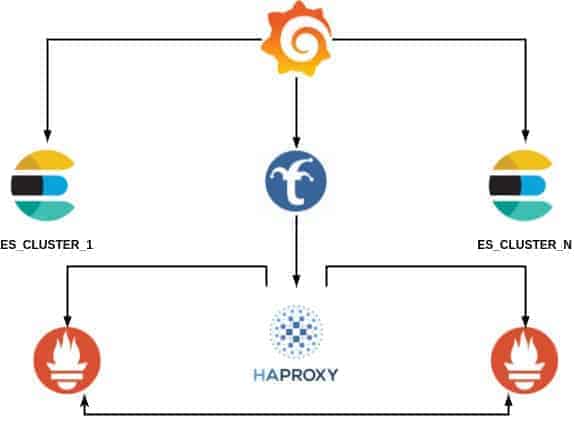
Prometheus nodes are independent while Alertmanager nodes form a cluster. If both Alertmanagers see the same alert they will deduplicate and fire once instead of multiple times.
We have plans to run plenty of blackbox_exporters and monitor every Hostinger client’s website because anything that cannot be monitored cannot be assessed.
We are looking forward to implementing more Prometheus nodes in the future so sharding nodes between multiple Prometheus instances. This would allow us to not have a bottleneck if one instance per region is down.