


Prometheus is one of the standard-bearing open-source solutions for monitoring and observability. From its humble origins at SoundCloud in 2012, Prometheus quickly garnered widespread adoption and later became one of the first CNCF projects and just the second to graduate (after Kubernetes). It’s used by tons of forward-thinking companies in production, including heavyweights like DigitalOcean, Fastly, and Weaveworks, and has its own dedicated yearly conference, PromCon.
Prometheus: powerful but intentionally limited
Prometheus has succeeded in part because the core Prometheus server and its various complements, such as Alertmanager, Grafana, and the exporter ecosystem, form a compelling end-to-end solution to a crucial but difficult problem. Prometheus does not, however, provide some of the capabilities that you’d expect from a full-fledged “as-a-Service” platform, such as multi-tenancy, authentication and authorization, and built-in long-term storage.
Cortex, which joined the CNCF in September as a sandbox project, is an open-source Prometheus-as-a-Service platform that seeks to fill those gaps and to thereby provide a complete, secure, multi-tenant Prometheus experience. I’ll say a lot about Cortex further down; first, let’s take a brief excursion into the more familiar world of Prometheus to get our bearings.
Why Prometheus?
As a CNCF developer advocate, I’ve had the opportunity to become closely acquainted both with the Prometheus community and with Prometheus as a tool (mostly working on docs and the Prometheus Playground). Its great success is really no surprise to me for a variety of reasons:
- Prometheus instances are easy to deploy and manage. I’m especially fond of near-instant configuration reloading and of the fact that all Prometheus components are available as static binaries.
- Prometheus offers a simple and easily adoptable metrics exposition format that makes it easy to write your own metrics exporters. This format is even being turned into an open standard via the OpenMetrics project (which also recently joined the CNCF sandbox).
- Prometheus offers a simple but powerful label-based querying language, PromQL, for working with time series data. I find PromQL to be highly intuitive
Why Prometheus-as-a-Service?
Early on, Prometheus’ core engineers made the wise decision to keep Prometheus lean and composable. From the get-go, Prometheus was designed to do a small set of things very well and to work seamlessly in conjunction with other, optional components (rather than overburdening Prometheus with an ever-growing array of hard-coded features and integrations). Here are some things that Prometheus was not meant to provide:
- Long-term storage – Individual Prometheus instances provide durable storage of time series data, but they do not act as a distributed data storage system with features like cross-node replication and automatic repair. This means that durability guarantees are restricted to that of a single machine. Fortunately, Prometheus offers a remote write API that can be used to pipe time series data to other systems.
- A global view of data – As described in the bullet point above, Prometheus instances act as isolated data storage units. Prometheus instances can be federated but that adds a lot of complexity to a Prometheus setup and again, Prometheus simply wasn’t built as a distributed database. This means that there’s no simple path to achieving a single, consistent, “global” view of your time series data.
- Multi-tenancy – Prometheus by itself has no built-in concept of a tenant. This means that it can’t provide any sort of fine-grained control over things like tenant-specific data access and resource usage quotas.
Why Cortex?
As a Prometheus-as-a-Service platform, Cortex fills in all of these crucial gaps with aplomb and thus provides a complete out-of-the-box solution for even the most demanding monitoring and observability use cases.
- It supports four long-term storage systems out of the box: AWS DynamoDB, AWS S3, Apache Cassandra, and Google Cloud Bigtable.
- It offers a global view of Prometheus time series data that includes data in long-term storage, greatly expanding the usefulness of PromQL for analytical purposes.
- It has multi-tenancy built into its very core. All Prometheus metrics that pass through Cortex are associated with a specific tenant.
The architecture of Cortex
Cortex has a fundamentally service-based design, with its essential functions split up into single-purpose components that can be independently scaled:
- Distributor – Handles time series data written to Cortex by Prometheus instances using Prometheus’ remote write API. Incoming data is automatically replicated and sharded, and sent to multiple Cortex ingesters in parallel.
- Ingester – Receives time series data from distributor nodes and then writes that data to long-term storage backends, compressing data into Prometheus chunks for efficiency.
- Ruler – Executes rules and generates alerts, sending them to Alertmanager (Cortex installations include Alertmanager).
- Querier – Handles PromQL queries from clients (including Grafana dashboards), abstracting over both ephemeral time series data and samples in long-term storage.
Each of these components can be managed independently, which is key to Cortex’s scalability and operations story. You can see a basic diagram of Cortex and the systems it interacts with below:
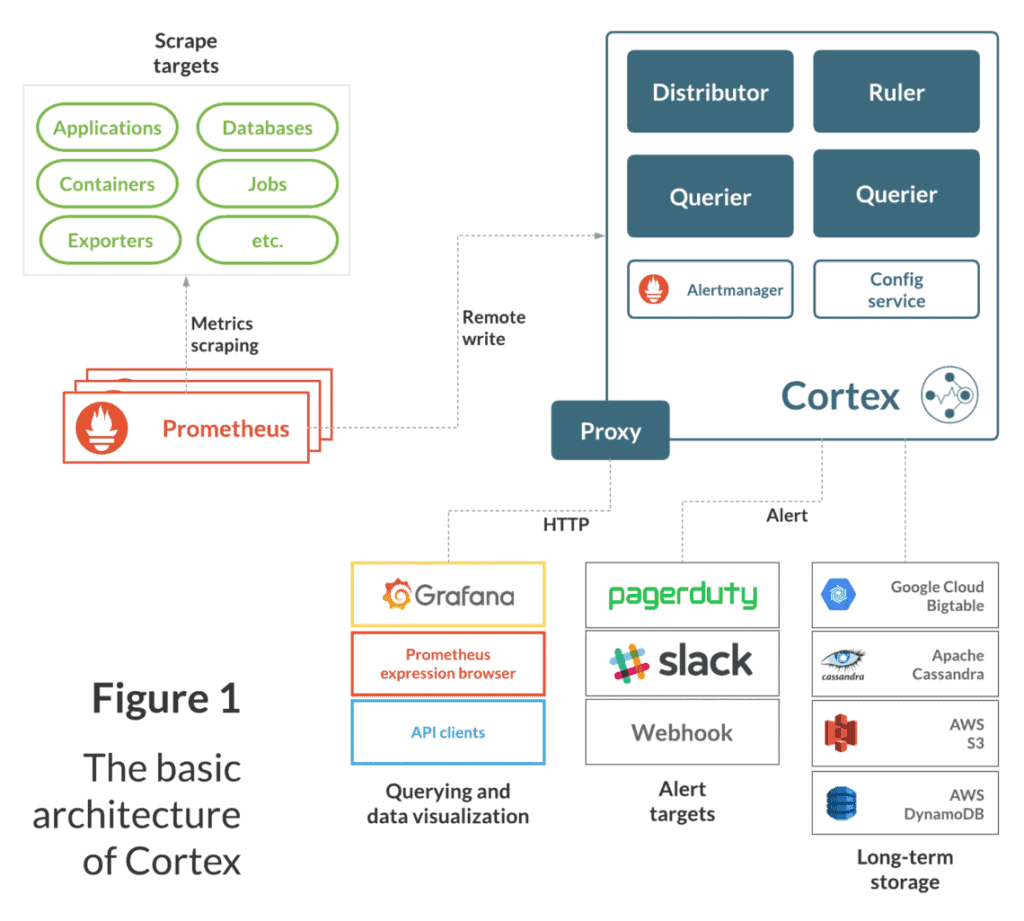
As the diagram shows, Cortex “completes” the Prometheus Monitoring System. To adapt it to existing Prometheus installations, you just need to re-configure your Prometheus instances to remote write to your Cortex cluster and Cortex handles the rest.
Multi-tenancy
Single-tenant systems tend to be fine for small use cases and non-production environments, but for large organizations with a plethora of teams, use cases, and environments, those systems become untenable (no pun intended). To meet the exacting requirements of such large organizations, Cortex provides multi-tenancy not as an add-on or a plugin but rather as a first-class capability.
Multi-tenancy is woven into the very fabric of Cortex. All time series data that arrives in Cortex from Prometheus instances is marked as belonging to a specific tenant in the request metadata. From there, that data can only be queried by the same tenant. Alerting is multi-tenant as well, with each tenant able to configure its own alerts using Alertmanager configuration.
In essence, each tenant has its own “view” of the system, its own Prometheus-centric world at its disposal. And if you do use Cortex in a single-tenant fashion, you can expand out to an indefinitely large pool of tenants at any time.
Use cases
Several years into its development, users of Cortex have tended to cluster into two broad categories:
- Service providers building hosted, managed platforms offering a monitoring and observability component. If you were building a Platform-as-a-Service offering like Heroku or Google App Engine, for example, Cortex would enable you to provide each application running on the platform with the full spectrum of capabilities provided by Prometheus and to treat each application (or perhaps each account or customer) as a separate tenant of the system.Weave Cloud and Grafana Labs are examples of comprehensive cloud platforms that use Cortex to enable customers to use Prometheus to the fullest.
- Enterprises with many internal customers running their own apps, services, and “stacks.”EA and StorageOS are examples of large enterprises that have benefited from Cortex.
Cortex, the Prometheus ecosystem, and the CNCF
Cortex has some highly compelling technological bona fides, but under the current industry Zeitgeist I also think it’s important to point out its open source bona fides as well:
- Cortex is under the Apache 2.0 license and backed by the CNCF.
- It’s tightly coupled only with other Apache 2.0 CNCF projects, with no strong interlinkages with closed-source, proprietary, or vendor-specific technologies.
- Project collaborators include Prometheus core maintainers like Goutham Veeramachaneni and Tom Wilkie, engineers from companies like Weaveworks, Grafana Labs, Platform9, and others heavily invested in the monitoring and observability space.
- Cortex is already running in production powering Weave Cloud and Grafana Cloud, two cloud offerings (and core contributors) whose success is crucially dependent on the future trajectory of Cortex.
With the addition of Cortex to the CNCF sandbox, there are now three Prometheus-related projects under the CNCF umbrella (including Prometheus itself and OpenMetrics). We know that monitoring and observability are essential components of the cloud native paradigm, and we’re happy to see continued convergence around some of the core primitives that have organically emerged from the Prometheus community. The Cortex project is energetically carrying this work forward and I’m excited the Prometheus-as-a-Service offshoot of the Prometheus ecosystem take shape.