
Founded in Montreal in 2012, L’Atelier Animation is an animation studio that specializes in the creation of 3D feature films and television series; including Ballerina, RoboZuna, and The Bravest.

With an infrastructure consisting of around 300 render blades, 150 workstations and 20 various servers, L’Atelier Animation, they needed a simple, but effective monitoring and alerting tool.
In the below blog, originally published on Prometheus.io, Philippe Panaite and Barthelemy Stevens from L’Atelier Animation talk about how they switched their animation studio from a mix of Nagios, Graphite and InfluxDB to Prometheus.
If you are attending KubeCon +CloudNativeCon North America (December 6-8 in Austin), catch the great sessions on Prometheus!
Interview with L’Atelier Animation
By Brian Brazil, Prometheus maintainer and founder of Robust Perception
Can you tell us about yourself and what L’Atelier Animation does?
L’Atelier Animation is a 3D animation studio based in the beautiful city of Montreal Canada. Our first feature film “Ballerina” (also known as “Leap”) was released worldwide in 2017, US release is expected later this year.
We’re currently hard at work on an animated TV series and on our second feature film. Our infrastructure consists of around 300 render blades, 150 workstations and twenty various servers. With the exception of a couple of Macs, everything runs on Linux (CentOS) and not a single Windows machine.
What was your pre-Prometheus monitoring experience?
At first we went with a mix of Nagios, Graphite, and InfluxDB. The initial setup was “ok” but nothing special and over complicated (too many moving parts).
Why did you decide to look at Prometheus?
When we switched all of our services to CentOS 7, we looked at new monitoring solutions and Prometheus came up for many reasons, but most importantly:
- Node Exporter: With its customization capabilities, we can fetch any data from clients
- SNMP support: Removes the need for a 3rd party SNMP service
- Alerting system: ByeBye Nagios
- Grafana support
How did you transition?
When we finished our first film we had a bit of a downtime so it was a perfect opportunity for our IT department to make big changes. We decided to flush our whole monitoring system as it was not as good as we wanted.
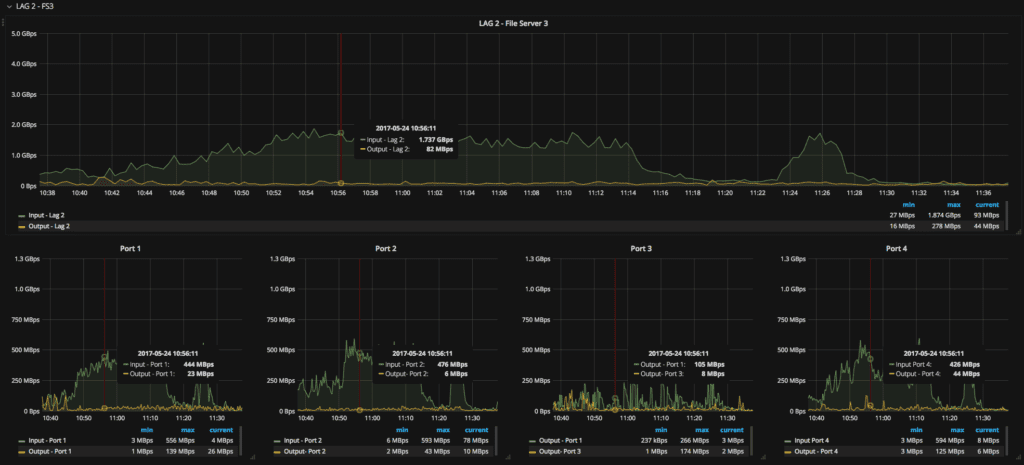
One of the most important part is to monitor networking equipment so we started by configuring snmp_exporter to fetch data from one of our switches. The calls to NetSNMP that the exporter makes are different under CentOS so we had to re-compile some of the binaries, we did encounter small hiccups here and there but with the help of Brian Brazil from Robust Perception, we got everything sorted out quickly. Once we got snmp_exporter working, we were able to easily add new devices and fetch SNMP data. We now have our core network monitored in Grafana (including 13 switches, 10 VLANs).
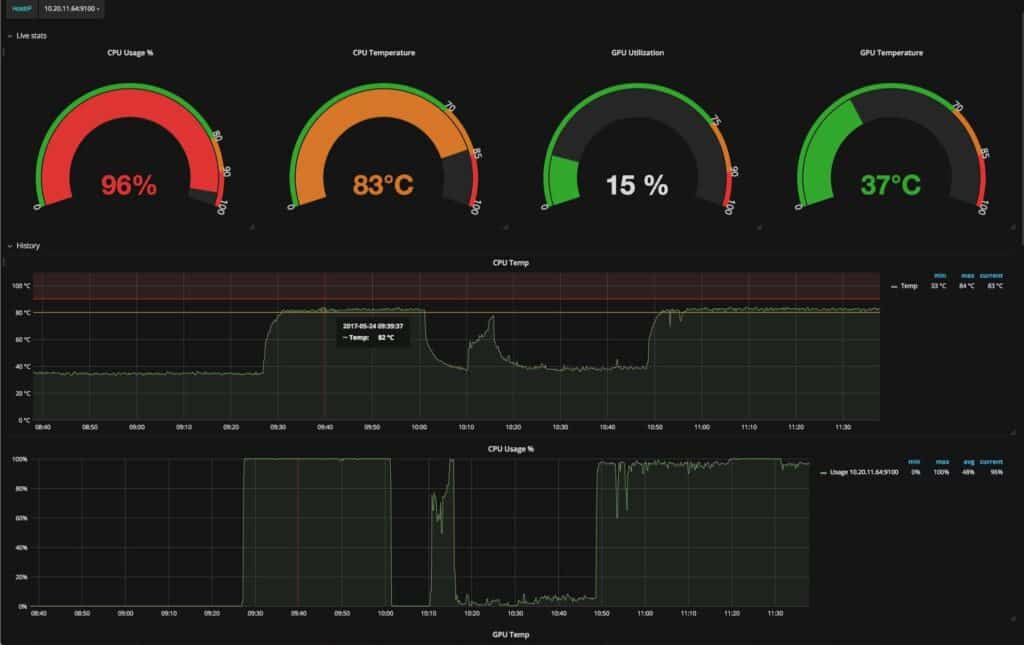
After that we configured node_exporter as we required analytics on workstations, render blades and servers. In our field, when a CPU is not at 100% it’s a problem, we want to use all the power we can so in the end temperature is more critical. Plus, we need as much uptime as possible so all our stations have email alerts setup via Prometheus’s Alertmanager so we’re aware when anything is down.
Our specific needs require us to monitor custom data from clients, it’s made easy through the use of node_exporter’s textfile collector function. A cronjob outputs specific data from any given tool into a pre-formatted text file in a format readable by Prometheus.
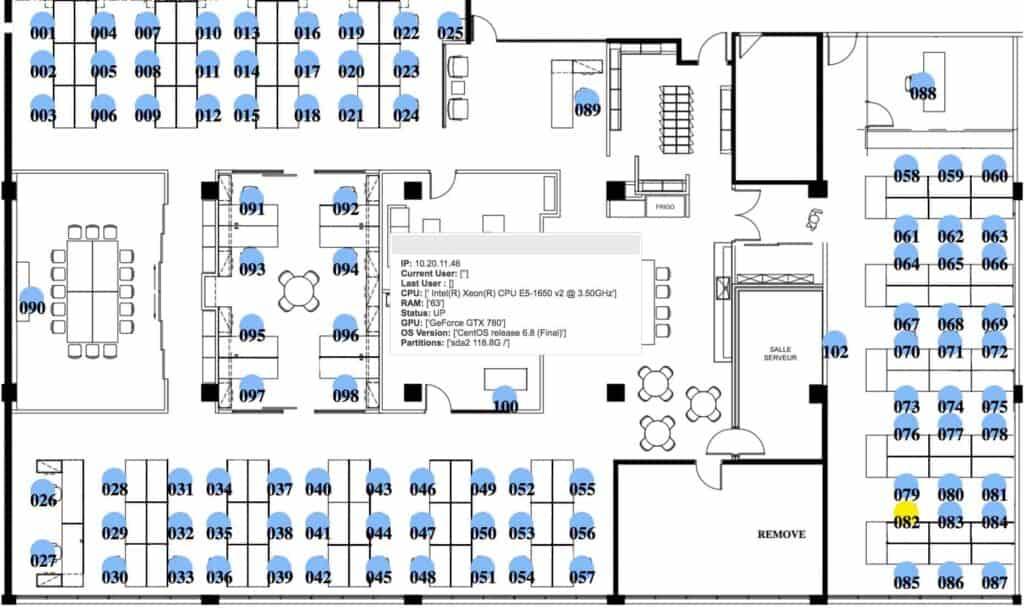
Since all the data is available through the HTTP protocol, we wrote a Python script to fetch data from Prometheus. We store it in a MySQL database accessed via a web application that creates a live floor map. This allows us to know with a simple mouse over which user is seated where with what type of hardware. We also created another page with user’s picture & department information, it helps new employees know who’s their neighbor. The website is still an ongoing project so please don’t judge the look, we’re sysadmins after all not web designers 🙂
What improvements have you seen since switching?
It gave us an opportunity to change the way we monitor everything in the studio and inspired us to create a new custom floor map with all the data which has been initially fetched by Prometheus. The setup is a lot simpler with one service to rule them all.
What do you think the future holds for L’Atelier Animation and Prometheus?
We’re currently in the process of integrating software licenses usage with Prometheus. The information will give artists a good idea of whom is using what and where.
We will continue to customize and add new stuff to Prometheus by user demand and since we work with artists, we know there will be plenty 🙂 With SNMP and the node_exporter’s custom text file inputs, the possibilities are endless…