

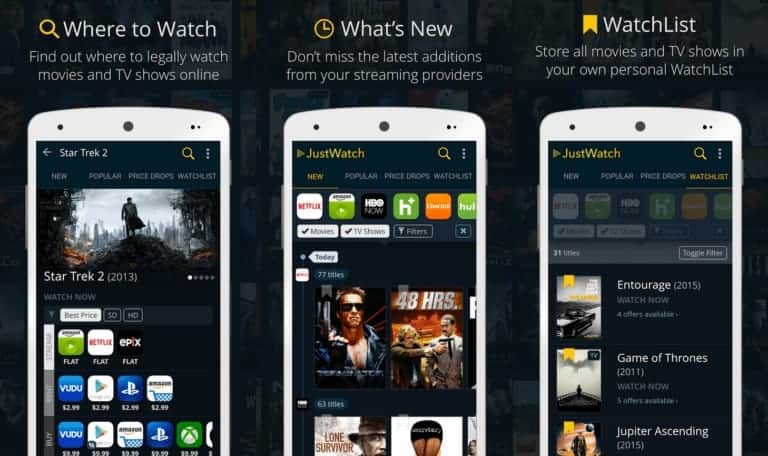
JustWatch is a streaming search engine that helps to find out where to watch movies and TV shows legally online and in theaters. You can search movie content across all major streaming providers like Netflix, HBO, Amazon Video, iTunes, Google Play, and many others in 17 countries.
As the largest streaming search engine worldwide, its engineering team of just 10 built and operates a fully dockerized stack of about 50 micro- and macro-services, running mostly on Kubernetes.
Before transitioning to Prometheus, the company mostly had blackbox monitoring –CloudWatch for some of the most important internal metrics, combined with external services like Pingdom for detecting site-wide outages. However, none of the classical host-based solutions satisfied the engineering team. Prometheus enlightened the team by making it incredibly easy to reap the benefits from whitebox monitoring and label-based canary deployments.
In the below blog, originally published by Prometheus, JustWatch talks about how they implemented Prometheus, what they monitor and what improvements they are hoping for in the future.
To hear more stories about Prometheus’ production use, participate in technical sessions on the monitoring tool, and learn how it integrates with Kubernetes and other open source technologies, attend PromCom 2017, August 17-18 at Google Munich. Register now.
Interview with JustWatch
Posted at: October 12, 2016 by Brian Brazil
Continuing our series of interviews with users of Prometheus, JustWatch talks about how they established their monitoring.
Can you tell us about yourself and what JustWatch does?
For consumers, JustWatch is a streaming search engine that helps to find out where to watch movies and TV shows legally online and in theaters. You can search movie content across all major streaming providers like Netflix, HBO, Amazon Video, iTunes, Google Play, and many others in 17 countries.
For our clients like movie studios or Video on Demand providers, we are an international movie marketing company that collects anonymized data about purchase behavior and movie taste of fans worldwide from our consumer apps. We help studios to advertise their content to the right audience and make digital video advertising a lot more efficient in minimizing waste coverage.
Since our launch in 2014 we went from zero to one of the largest 20k websites internationally without spending a single dollar on marketing – becoming the largest streaming search engine worldwide in under two years. Currently, with an engineering team of just 10, we build and operate a fully dockerized stack of about 50 micro- and macro-services, running mostly on Kubernetes.
What was your pre-Prometheus monitoring experience?
At prior companies many of us worked with most of the open-source monitoring products there are. We have quite some experience working with Nagios, Icinga, Zabbix, Monit, Munin, Graphite and a few other systems. At one company I helped build a distributed Nagios setup with Puppet. This setup was nice, since new services automatically showed up in the system, but taking instances out was still painful. As soon as you have some variance in your systems, the host and service based monitoring suites just don’t fit quite well. The label-based approach Prometheus took was something I always wanted to have, but didn’t find before.
Why did you decide to look at Prometheus?
At JustWatch the public Prometheus announcement hit exactly the right time. We mostly had blackbox monitoring for the first few months of the company – CloudWatch for some of the most important internal metrics, combined with a external services like Pingdom for detecting site-wide outages. Also, none of the classical host-based solutions satisfied us. In a world of containers and microservices, host-based tools like Icinga, Thruk or Zabbix felt antiquated and not ready for the job. When we started to investigate whitebox monitoring, some of us luckily attended the Golang Meetup where Julius and Björn announced Prometheus. We quickly set up a Prometheus server and started to instrument our Go services (we use almost only Go for the backend). It was amazing how easy that was – the design felt like being cloud- and service-oriented as a first principle and never got in the way.
How did you transition?
Transitioning wasn’t that hard, as timing wise, we were lucky enough to go from no relevant monitoring directly to Prometheus.
The transition to Prometheus was mostly including the Go client into our apps and wrapping the HTTP handlers. We also wrote and deployed several exporters, including the node_exporter and several exporters for cloud provider APIs. In our experience monitoring and alerting is a project that is never finished, but the bulk of the work was done within a few weeks as a side project.
Since the deployment of Prometheus we tend to look into metrics whenever we miss something or when we are designing new services from scratch.
It took some time to fully grasp the elegance of PromQL and labels concept fully, but the effort really paid off.
What improvements have you seen since switching?
Prometheus enlightened us by making it incredibly easy to reap the benefits from whitebox monitoring and label-based canary deployments. The out-of-the-box metrics for many Golang aspects (HTTP Handler, Go Runtime) helped us to get to a return on investment very quickly – goroutine metrics alone saved the day multiple times. The only monitoring component we actually liked before – Grafana – feels like a natural fit for Prometheus and has allowed us to create some very helpful dashboards. We appreciated that Prometheus didn’t try to reinvent the wheel but rather fit in perfectly with the best solution out there. Another huge improvement on predecessors was Prometheus’s focus on actually getting the math right (percentiles, etc.). In other systems, we were never quite sure if the operations offered made sense. Especially percentiles are such a natural and necessary way of reasoning about microservice performance that it felt great that they get first class treatment.
The integrated service discovery makes it super easy to manage the scrape targets. For Kubernetes, everything just works out-of-the-box. For some other systems not running on Kubernetes yet, we use a Consul-based approach. All it takes to get an application monitored by Prometheus is to add the client, expose /metrics and set one simple annotation on the Container/Pod. This low coupling takes out a lot of friction between development and operations – a lot of services are built well orchestrated from the beginning, because it’s simple and fun.
The combination of time-series and clever functions make for awesome alerting super-powers. Aggregations that run on the server and treating both time-series, combinations of them and even functions on those combinations as first-class citizens makes alerting a breeze – often times after the fact.
What do you think the future holds for JustWatch and Prometheus?
While we value very much that Prometheus doesn’t focus on being shiny but on actually working and delivering value while being reasonably easy to deploy and operate – especially the Alertmanager leaves a lot to be desired yet. Just some simple improvements like simplified interactive alert building and editing in the frontend would go a long way in working with alerts being even simpler.
We are really looking forward to the ongoing improvements in the storage layer, including remote storage. We also hope for some of the approaches taken in Project Prism and Vulcan to be backported to core Prometheus. The most interesting topics for us right now are GCE Service Discovery, easier scaling, and much longer retention periods (even at the cost of colder storage and much longer query times for older events).
We are also looking forward to use Prometheus for more non-technical departments as well. We’d like to cover most of our KPIs with Prometheus to allow everyone to create beautiful dashboards, as well as alerts. We’re currently even planning to abuse the awesome alert engine for a new, internal business project as well – stay tuned!