
A local area network gathering with live concerts and competitions in digital art and esports, DreamHack is considered the world’s largest digital festival. In fact, it was recognized by the Guinness Book of Records and Twin Galaxies as being the world’s largest LAN party and computer festival, as well as having the world’s fastest Internet connection, and the most generated traffic.
DreamHack hosts several of these events throughout Europe: in Stockholm and Jönköping, Sweden; Tours, France; Bucharest and Cluj, Romania; Valencia, Spain; London, England and Leipzig, Germany; and in North America: Austin, Texas; and Montreal, Quebec.

The Network Team at Dreamhack builds the infrastructure each amazing pop-up event from scratch in just five days! To put this in perspective, an ordinary infrastructure of this size takes months to build. To tackle something of this magnitude in such a short time-frame takes an impressively talented team and the ability to have eyes and ears in every facet of the network. This is where Prometheus helps.
In this blog, originally published on the Prometheus blog, Christian Svensson from Dreamhack’s Networking Team shares his experiences evaluating and using Prometheus.
Going to PromCon? Svensson will be presenting the below case study on August 25th. Make sure to check him out live!
Monitoring DreamHack – the World’s Largest Digital Festival
Posted at: June 24, 2015 by Christian Svensson (DreamHack Network Team) Editor’s note: This article is a guest post written by a Prometheus user.
If you are operating the network for 10,000’s of demanding gamers, you need to really know what is going on inside your network. Oh, and everything needs to be built from scratch in just five days.
If you have never heard about DreamHack before, here is the pitch: Bring 20,000 people together and have the majority of them bring their own computer. Mix in professional gaming (eSports), programming contests, and live music concerts. The result is the world’s largest festival dedicated solely to everything digital.
To make such an event possible, there needs to be a lot of infrastructure in place. Ordinary infrastructures of this size take months to build, but the crew at DreamHack builds everything from scratch in just five days. This of course includes stuff like configuring network switches, but also building the electricity distribution, setting up stores for food and drinks, and even building the actual tables.
The team that builds and operates everything related to the network is officially called the Network team, but we usually refer to ourselves as tech or dhtech. This post is going to focus on the work of dhtech and how we used Prometheus during DreamHack Summer 2015 to try to kick our monitoring up another notch.
The equipment
Turns out that to build a highly performant network for 10,000+ computers, you need at least the same number of network ports. In our case these come in the form of ~400 Cisco 2950 switches. We call these the access switches. These are everywhere in the venue where participants will be seated with their computers.

Dutifully standing in line, the access switches are ready to greet the DreamHackers with high-speed connectivity.
Obviously just connecting all these computers to a switch is not enough. That switch needs to be connected to the other switches as well. This is where the distribution switches (or dist switches) come into play. These are switches that take the hundreds of links from all access switches and aggregate them into more manageable 10-Gbit/s high-capacity fibre. The dist switches are then further aggregated into our core, where the traffic is routed to its destination.
On top of all of this, we operate our own WiFi networks, DNS/DHCP servers, and other infrastructure. When completed, our core looks something like the image below.
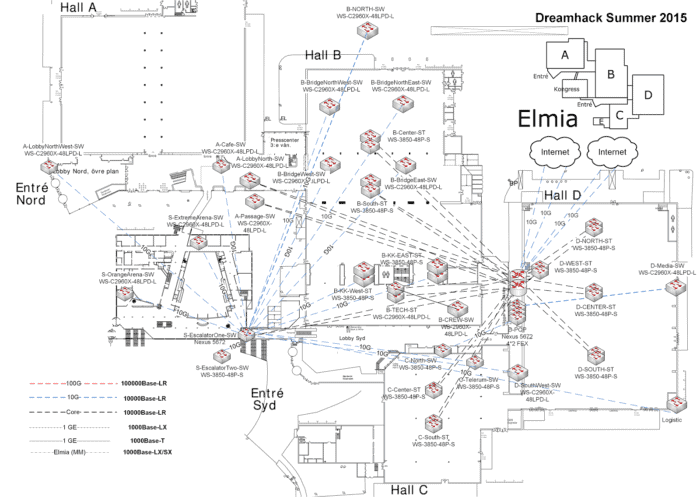
The planning map for the distribution and core layers. The core is clearly visible in “Hall D”
All in all this is becoming a lengthy list of stuff to monitor, so let’s get to the reason you’re here: How do we make sure we know what’s going on?
Introducing: dhmon
dhmon is the collective name of the systems that not only monitor the network, but also allow other teams to collect metrics on whatever they want.
Since the network needs to be built in five days, it’s essential that the monitoring systems are easy to set up and keep in sync if we need to do last minute infrastructural changes (like adding or removing devices). When we start to build the network, we need monitoring as soon as possible to be able to discover any problems with the equipment or other issues we hadn’t foreseen.
In the past we have tried to use a mix of commonly available software such as Cacti, SNMPc, and Opsview among others. While these have worked they have focused on being closed systems and only provided the bare minimum. A few years back a few people from the team said “Enough, we can do better ourselves!” and started writing a custom monitoring solution.
At the time the options were limited. Over the years the system went from using Graphite (scalability issues), a custom Cassandra store (high complexity), and InfluxDB (immature software) to finally land on using Prometheus. I first learned about Prometheus back in 2014 when I met Julius Volz and I had been eager to try it ever since. This summer we finally replaced the custom InfluxDB-based metrics store that we had written with Prometheus. Spoiler: We’re not going back.
The architecture
The monitoring solution consists of three layers: collection, storage, presentation. Our most critical collectors are snmpcollector (SNMP) and ipplan-pinger (ICMP), closely followed by dhcpinfo (DHCP lease stats). We also have some scripts that dump stats about other systems into node_exporter‘s textfile collector.
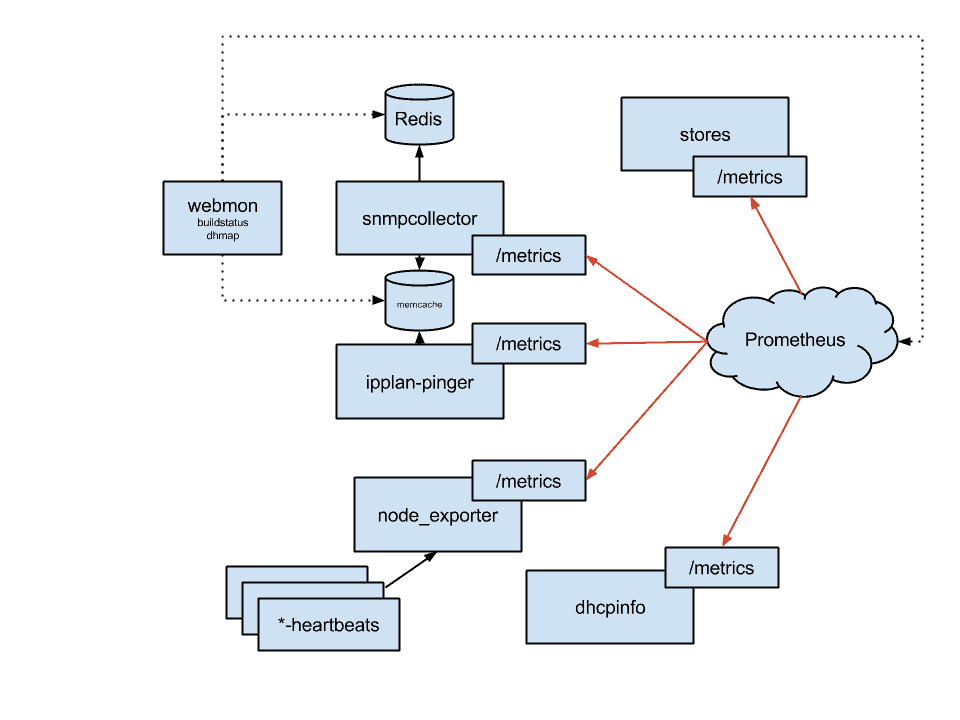
The current architecture plan of dhmon as of Summer 2015
We use Prometheus as a central timeseries storage and querying engine, but we also use Redis and memcached to export snapshot views of binary information that we collect but cannot store in Prometheus in any sensible way, or when we need to access very fresh data.
One such case is in our presentation layer. We use our dhmap web application to get an overview of the overall health of the access switches. In order to be effective at resolving errors, we need a latency of ~10 seconds from data collection to presentation. Our goal is to have fixed the problem before the customer notices, or at least before they have walked over to the support people to report an issue. For this reason, we have been using memcached since the beginning to access the latest snapshot of the network.
We continued to use memcached this year for our low-latency data, while using Prometheus for everything that’s historical or not as latency-sensitive. This decision was made simply because we were unsure how Prometheus would perform at very short sampling intervals. In the end, we found no reason for why we can’t use Prometheus for this data as well – we will definitely try to replace our memcached with Prometheus at the next DreamHack.
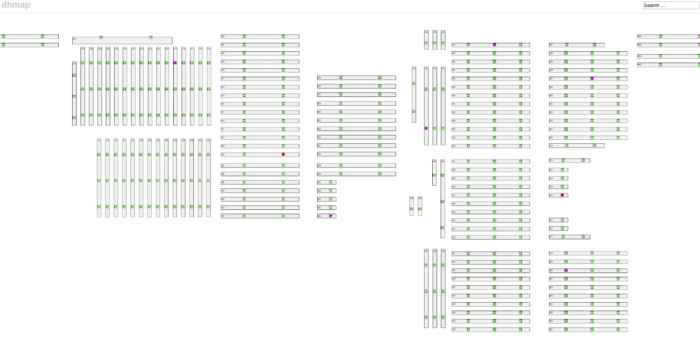
The overview of our access layer visualized by dhmon
Prometheus setup
The block that so far has been referred to as Prometheus really consists of three products: Prometheus, PromDash, and Alertmanager. The setup is fairly basic and all three components are running on the same host. Everything is served by an Apache web server that just acts as a reverse proxy.
ProxyPass /prometheus http://localhost:9090/prometheus
ProxyPass /alertmanager http://localhost:9093/alertmanager
ProxyPass /dash http://localhost:3000/dash
Exploring the network
Prometheus has a powerful querying engine that allows you to do pretty cool things with the streaming information collected from all over your network. However, sometimes the queries need to process too much data to finish within a reasonable amount of time. This happened to us when we wanted to graph the top 5 utilized links out of ~18,000 in total. While the query worked, it would take roughly the amount of time we set our timeout limit to, meaning it was both slow and flaky. We decided to use Prometheus’ recording rules for precomputing heavy queries.
precomputed_link_utilization_percent = rate(ifHCOutOctets{layer!=’access’}[10m])*8/1000/1000
/ on (device,interface,alias)
ifHighSpeed{layer!=’access’}
After this, running topk(5, precomputed_link_utilization_percent) was blazingly fast.
Being reactive: alerting
So at this stage we had something we could query for the state of the network. Since we are humans, we don’t want to spend our time running queries all the time to see if things are still running as they should, so obviously we need alerting.
For example: we know that all our access switches use GigabitEthernet0/2 as an uplink. Sometimes when the network cables have been in storage for too long they oxidize and are not able to negotiate the full 1000 Mbps that we want.
The negotiated speed of a network port can be found in the SNMP OID IF-MIB::ifHighSpeed. People familiar with SNMP will however recognize that this OID is indexed by an arbitrary interface index. To make any sense of this index, we need to cross-reference it with data from SNMP OID IF-MIB::ifDescr to retrieve the actual interface name.
Fortunately, our snmpcollector supports this kind of cross-referencing while generating Prometheus metrics. This allows us in a simple way to not only query data, but also define useful alerts. In our setup we configured the SNMP collection to annotate any metric under the IF-MIB::ifTable and IF-MIB::ifXTable OIDs with ifDescr. This will come in handy now when we need to specify that we are only interested in the GigabitEthernet0/2 port and no other interface.
Let’s have a look at what such an alert definition looks like.
ALERT BadUplinkOnAccessSwitch
IF ifHighSpeed{layer=’access’, interface=’GigabitEthernet0/2′} < 1000 FOR 2m
SUMMARY “Interface linking at {{$value}} Mbps”
DESCRIPTION “Interface {{$labels.interface}} on {{$labels.device}} linking at {{$value}} Mbps”
Done! Now we will get an alert if a switch’s uplink suddenly links at a non-optimal speed.
Let’s also look at how an alert for an almost full DHCP scope looks like:
ALERT DhcpScopeAlmostFull
IF ceil((dhcp_leases_current_count / dhcp_leases_max_count)*100) > 90 FOR 2m
SUMMARY “DHCP scope {{$labels.network}} is almost full”
DESCRIPTION “DHCP scope {{$labels.network}} is {{$value}}% full”
We found the syntax to define alerts easy to read and understand even if you had no previous experience with Prometheus or time series databases.
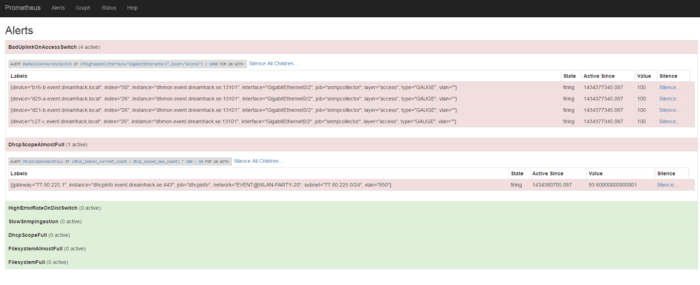
Oops! Turns out we have some bad uplinks, better run out and fix it!
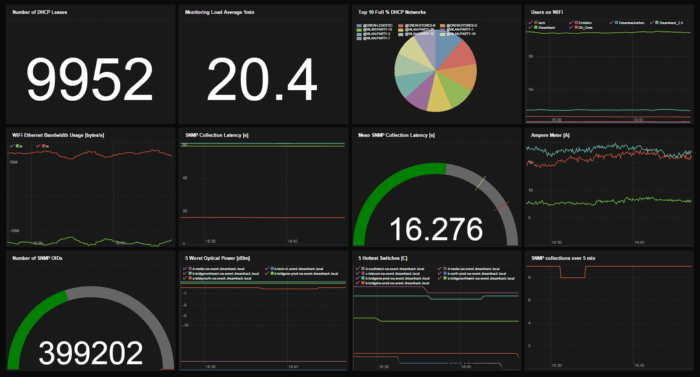
Being proactive: dashboards
While alerting is an essential part of monitoring, sometimes you just want to have a good overview of the health of your network. To achieve this we used PromDash. Every time someone asked us something about the network, we crafted a query to get the answer and saved it as a dashboard widget. The most interesting ones were then added to an overview dashboard that we proudly displayed.
The future
While changing an integral part of any system is a complex job and we’re happy that we managed to integrate Prometheus in just one event, there are without a doubt a lot of areas to improve. Some areas are pretty basic: using more precomputed metrics to improve performance, adding more alerts, and tuning the ones we have. Another area is to make it easier for operators: creating an alert dashboard suitable for our network operations center (NOC), figuring out if we want to page the people on-call, or just let the NOC escalate alerts.
Some bigger features we’re planning on adding: syslog analysis (we have a lot of syslog!), alerts from our intrusion detection systems, integrating with our Puppet setup, and also integrating more across the different teams at DreamHack. We managed to create a proof-of-concept where we got data from one of the electrical current sensors into our monitoring, making it easy to see if a device is faulty or if it simply doesn’t have any electricity anymore. We’re also working on integrating with the point-of-sale systems that are used in the stores at the event. Who doesn’t want to graph the sales of ice cream?
Finally, not all services that the team operates are on-site, and some even run 24/7 after the event. We want to monitor these services with Prometheus as well, and in the long run when Prometheus gets support for federation, utilize the off-site Prometheus to replicate the metrics from the event Prometheus.
Closing words
We’re really excited about Prometheus and how easy it makes setting up scalable monitoring and alerting from scratch.
A huge shout-out to everyone that helped us in #prometheus on FreeNode during the event. Special thanks to Brian Brazil, Fabian Reinartz and Julius Volz. Thanks for helping us even in the cases where it was obvious that we hadn’t read the documentation thoroughly enough.
Finally, dhmon is all open-source, so head over to https://github.com/dhtech/ and have a look if you’re interested. If you feel like you would like to be a part of this, just head over to #dreamhack on QuakeNet and have a chat with us. Who knows, maybe you will help us build the next DreamHack?