


In January, Prometheus celebrated a year of public existence and today they announced Prometheus 1.0, which delivers a stable API and user interface.
“After almost four years of development, we are finally releasing Prometheus version 1.0. While Prometheus has been ready for production use for a long time, users still had to manage frequent breaking changes to interfaces such as the configuration files, the HTTP APIs, and the query language. The 1.0 version signals to users that they can now build on Prometheus as an API-stable platform.” – said Julius Volz, infrastructure engineer and co-creator of Prometheus
Prometheus 1.0 Release
An open-source systems monitoring and alerting ecosystem built with modern cloud and container environments in mind, Prometheus supports multiple types of dynamic service discovery. The core of Prometheus is its multidimensional data model with a dedicated powerful query language, which allows users to identify time series by metric name and key/value pairs. Additional features and components can be found here.
Top pain-points Prometheus solves for users:
- Ad-hoc explorability at all scales, from individual components to fleet-wide metrics.
- Meaningful alerts and dashboards.
- Consistent semantics – both horizontally (different kinds of monitorings: services, hosts, hardware, etc.) and vertically (from instrumentation to collection to processing to presentation to alerting).
The integration of these features is important for cloud native apps, due to the high frequency and volume of instrumentation data in modern architectures.
Prometheus 1.0 means upgrades won’t break programs built atop the Prometheus API, and updates won’t require storage re-initialization or deployment changes. Additionally, custom dashboards and alerts will remain intact across 1.x version updates as well. With the Prometheus server in a stable API state, other modules will become stable version 1.0 releases in the future.
“Prometheus 1.0 gives users the confidence that the powerful monitoring and alerting they deploy today with Prometheus will continue to work as features are added in the future.” – said Brian Brazil, founder of Robust Perception and core developer of Prometheus
For more on Prometheus 1.0, read the Prometheus announcement blog and Brian Brazil’s dive into the new features.
Benefits to the Cloud Native Stack
“Prometheus’s ability to monitor different layers in the cloud native stack with the same semantics is vital, as it can alleviate some of the complications throughout the stack. For example, Prometheus helps to understand what’s going on in complex microservice setups, which is hard to accomplish using conventional monitoring approaches.” – Björn Rabenstein, engineer at SoundCloud and Prometheus core developer
The Prometheus software for monitoring and analysis of cloud native architectures and time series data benefits cloud developers, DevOps and end users in the following ways:
Cloud developers: Easy instrumentation of your code, which will not only help in production, but also during development to spot performance issues and other irregularities. Kubernetes scheduler performance was increased by 10x by debugging using Prometheus. Additionally, Prometheus does not lock you in as there are many integration points with other systems.
DevOps: Finally you can implement the alerting you want and ask the questions you always needed answers for.
End users: The increased reliability and better performance of Prometheus is a major benefit to end users. As the first company using Prometheus, SoundCloud was able to detect and handle outages much better than before and increase the site’s availability significantly. Additional end user case studies include Life360 and ShowMax.
The Prometheus Community
With 350+ contributors worldwide and 8,671 commits, this monitoring tool created in 2012 is quickly becoming a high velocity project. Prometheus has an active and growing user base counting SoundCloud, Digital Ocean, Ericsson, CoreOS, Weaveworks, Red Hat, and Google among its many users. Prometheus has grown to become one of the top open source monitoring tools of choice for the modern platform.
Here are some recent stats on the growing Prometheus ecosystem:
37 repositories in its GitHub organization
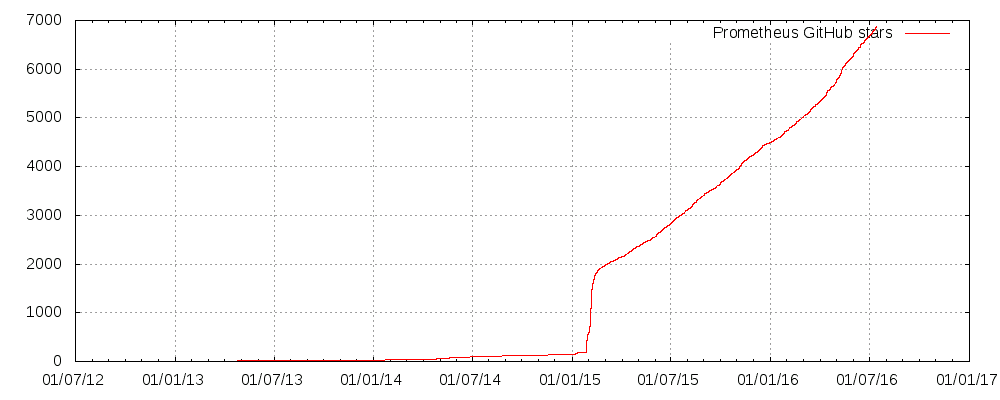
6867 stars for all repos
5274 stars for the main prometheus/prometheus repo
350+ contributors
To get started with Prometheus or join its community, please visit the Getting Started page of the project’s website and the Community page of the project’s website for more information.
Prometheus and Kubernetes
Prometheus integrates with CNCF’s first hosted project, Kubernetes, which recently announced the release of its 1.3 version, to support service discovery and monitoring of dynamically scheduled services. Kubernetes also supports Prometheus natively.
“Despite their independent developments, Kubernetes and Prometheus are both inspired by the way and spirit of how Google has been running large-scale production systems. This led to a convergent evolution. Even before Prometheus entered the CNCF, Kubernetes components were instrumented with Prometheus metrics. Prometheus in turn has native support for the Kubernetes service discovery mechanism. The label-based approach native to both technologies propagates perfectly through their combined stack. Prometheus answers the question of how to monitor your existing Kubernetes cluster, and Kubernetes is the answer if you need an orchestration system that can be easily monitored with your existing Prometheus installation.” – said Fabian Reinartz, engineer at CoreOS and Prometheus core developer.
The Origin of Prometheus
To most, Prometheus is a Titan in Greek mythology, best known as the deity who created mankind and its greatest benefactor, who stole fire from Mount Olympus and gave it to mankind.
The Prometheus we are referring to is the all knowing monitoring system that was built with modern cloud and container environments in mind. Created in 2012 under the Apache 2.0 license on GitHub, Prometheus was gradually introduced for production monitoring at SoundCloud in 2013 and quietly grew in popularity in the cloud native space.
Read Björn Rabenstein’s blog on how SoundCloud served as the cradle of Prometheus and how beneficial it was for a company to develop a project like Prometheus in the open.
The Next Platform does a wonderful job of retelling the Prometheus history, its natural use with Kubernetes and becoming an incubated project with The Cloud Native Computing Foundation. Read the article here.
Through infrastructure, technical and marketing support, CNCF is helping to accelerate adoption of technologies like Prometheus that are key to modern infrastructure stacks. This in turn inspires faster adoption of cloud native architectures among companies of any size, and in any industries.
PrometheusDay, co-located with CloudNativeCon
Hosted by CNCF and co-located with CloudNativeCon, PrometheusDay will feature highly technical talks covering major Prometheus adopters, leading expert contributor insights, and a full range of technologies that support open source monitoring technology in the cloud native ecosystem. Registration for CloudNativeCon, Nov. 8-9 in Seattle, includes complimentary attendance at PrometheusDay. Developers, members and industry experts are invited to submit a speaking proposal by August 5th for CloudNativeCon and PrometheusDay.