
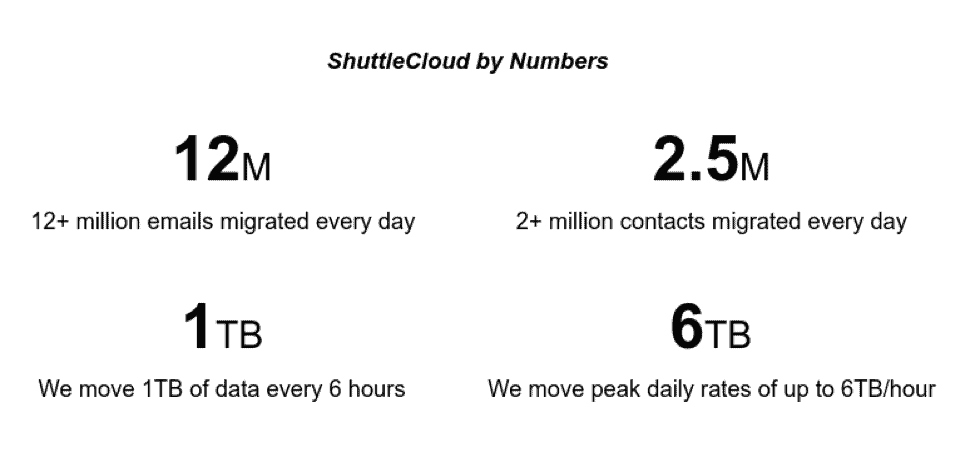
ShuttleCloud is a small startup specialized in email and contacts migrations. The company developed a reliable migration platform in high availability used by clients like Gmail, Gcontacts and Comcast. For example, Gmail alone has imported data for 3 million users with our API and we process hundreds of terabytes every month.
Before transitioning to Prometheus, the company had near-zero monitoring. Now they have all of their infrastructure monitored with the necessary metrics and alerts. ShuttleCloud currently has around 200 instances monitored with a comfortable cost-effective in-house monitoring stack based on Prometheus.
In the below blog, originally published by Prometheus, ShuttleCloud talks about why a company does not need a big fleet to embrace Prometheus and that it is a non-expensive solution for monitoring.
Ignacio P. Carretero, Software Engineer at ShuttleCloud, also spoke on this topic at CloudNativeCon + KubeCon North America 2016. The video of his presentation can be found here and slides can be found here.
To hear more stories about Prometheus’ production use, participate in technical sessions on the monitoring tool, and learn how it integrates with Kubernetes and other open source technologies, attend PromCom 2017, August 17-18 at Google Munich. Speaking submissions close May 31st. Submit here.
Interview with ShuttleCloud
Posted at: September 7, 2016 by Brian Brazil
Continuing our series of interviews with users of Prometheus, ShuttleCloud talks about how they began using Prometheus. Ignacio from ShuttleCloud also explained how Prometheus Is Good for Your Small Startup at PromCon 2016.
What does ShuttleCloud do?
ShuttleCloud is the world’s most scalable email and contacts data importing system. We help some of the leading email and address book providers, including Google and Comcast, increase user growth and engagement by automating the switching experience through data import.
By integrating our API into their offerings, our customers allow their users to easily migrate their email and contacts from one participating provider to another, reducing the friction users face when switching to a new provider. The 24/7 email providers supported include all major US internet service providers: Comcast, Time Warner Cable, AT&T, Verizon, and more.
By offering end users a simple path for migrating their emails (while keeping complete control over the import tool’s UI), our customers dramatically improve user activation and onboarding.
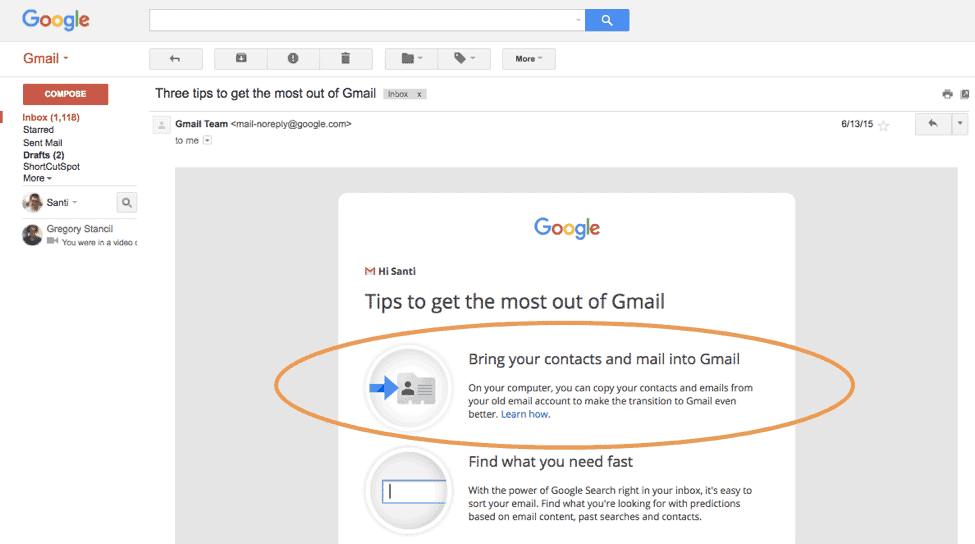
ShuttleCloud’s integration with Google’s Gmail Platform. Gmail has imported data for 3 million users with our API.
ShuttleCloud’s technology encrypts all the data required to process an import, in addition to following the most secure standards (SSL, oAuth) to ensure the confidentiality and integrity of API requests. Our technology allows us to guarantee our platform’s high availability, with up to 99.5% uptime assurances.
What was your pre-Prometheus monitoring experience?
In the beginning, a proper monitoring system for our infrastructure was not one of our main priorities. We didn’t have as many projects and instances as we currently have, so we worked with other simple systems to alert us if anything was not working properly and get it under control.
- We had a set of automatic scripts to monitor most of the operational metrics for the machines. These were cron-based and executed, using Ansible from a centralized machine. The alerts were emails sent directly to the entire development team.
- We trusted Pingdom for external blackbox monitoring and checking that all our frontends were up. They provided an easy interface and alerting system in case any of our external services were not reachable.
Fortunately, big customers arrived, and the SLAs started to be more demanding. Therefore, we needed something else to measure how we were performing and to ensure that we were complying with all SLAs. One of the features we required was to have accurate stats about our performance and business metrics (i.e., how many migrations finished correctly), so reporting was more on our minds than monitoring.
We developed the following system:
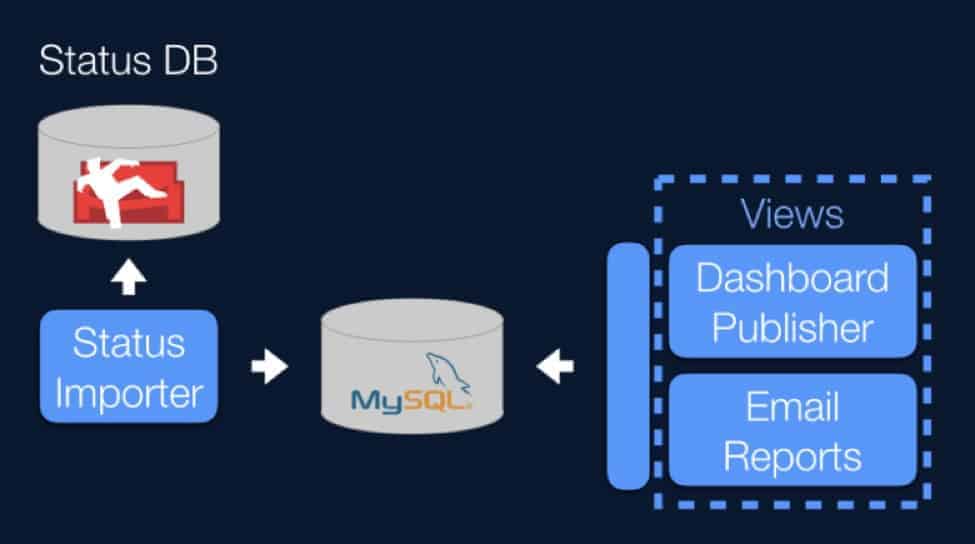
- The source of all necessary data is a status database in a CouchDB. There, each document represents one status of an operation. This information is processed by the Status Importer and stored in a relational manner in a MySQL database.
- A component gathers data from that database, with the information aggregated and post-processed into several views.
- One of the views is the email report, which we needed for reporting purposes. This is sent via email.
- The other view pushes data to a dashboard, where it can be easily controlled. The dashboard service we used was external. We trusted Ducksboard, not only because the dashboards were easy to set up and looked beautiful, but also because they provided automatic alerts if a threshold was reached.
With all that in place, it didn’t take us long to realize that we would need a proper metrics, monitoring, and alerting system as the number of projects started to increase.
Some drawbacks of the systems we had at that time were:
- No centralized monitoring system. Each metric type had a different one:
- System metrics → Scripts run by Ansible.
- Business metrics → Ducksboard and email reports.
- Blackbox metrics → Pingdom.
- No standard alerting system. Each metric type had different alerts (email, push notification, and so on).
- Some business metrics had no alerts. These were reviewed manually.
Why did you decide to look at Prometheus?
We analyzed several monitoring and alerting systems. We were eager to get our hands dirty and check if the a solution would succeed or fail. The system we decided to put to the test was Prometheus, for the following reasons:
- First of all, you don’t have to define a fixed metric system to start working with it; metrics can be added or changed in the future. This provides valuable flexibility when you don’t know all of the metrics you want to monitor yet.
- If you know anything about Prometheus, you know that metrics can have labels that abstract us from the fact that different time series are considered. This, together with its query language, provided even more flexibility and a powerful tool. For example, we can have the same metric defined for different environments or projects and get a specific time series or aggregate certain metrics with the appropriate labels:
- http_requests_total{job=”my_super_app_1″,environment=”staging”} – the time series corresponding to the staging environment for the app “my_super_app_1”.
- http_requests_total{job=”my_super_app_1″} – the time series for all environments for the app “my_super_app_1”.
- http_requests_total{environment=”staging”} – the time series for all staging environments for all jobs.
- Prometheus supports a DNS service for service discovery. We happened to already have an internal DNS service.
- There is no need to install any external services (unlike Sensu, for example, which needs a data-storage service like Redis and a message bus like RabbitMQ). This might not be a deal breaker, but it definitely makes the test easier to perform, deploy, and maintain.
- Prometheus is quite easy to install, as you only need to download an executable Go file. The Docker container also works well and it is easy to start.
How do you use Prometheus?
Initially we were only using some metrics provided out of the box by the node_exporter, including:
- hard drive usage.
- memory usage.
- if an instance is up or down.
Our internal DNS service is integrated to be used for service discovery, so every new instance is automatically monitored.
Some of the metrics we used, which were not provided by the node_exporter by default, were exported using the node_exporter textfile collector feature. The first alerts we declared on the Prometheus Alertmanager were mainly related to the operational metrics mentioned above.
We later developed an operation exporter that allowed us to know the status of the system almost in real time. It exposed business metrics, namely the statuses of all operations, the number of incoming migrations, the number of finished migrations, and the number of errors. We could aggregate these on the Prometheus side and let it calculate different rates.
We decided to export and monitor the following metrics:
- operation_requests_total
- operation_statuses_total
- operation_errors_total
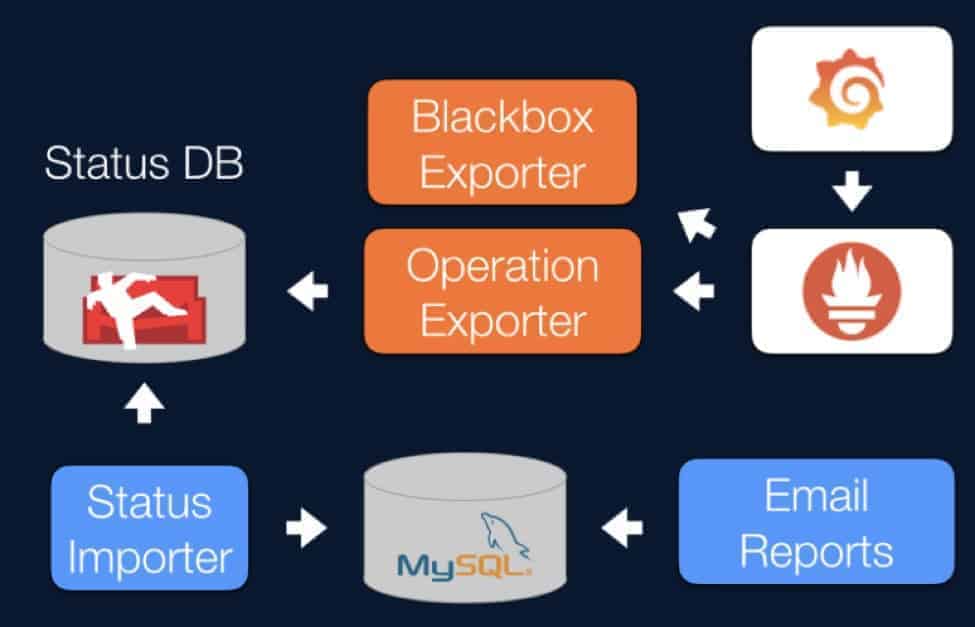
We have most of our services duplicated in two Google Cloud Platform availability zones. That includes the monitoring system. It’s straightforward to have more than one operation exporter in two or more different zones, as Prometheus can aggregate the data from all of them and make one metric (i.e., the maximum of all). We currently don’t have Prometheus or the Alertmanager in HA – only a metamonitoring instance – but we are working on it.
For external blackbox monitoring, we use the Prometheus Blackbox Exporter. Apart from checking if our external frontends are up, it is especially useful for having metrics for SSL certificates’ expiration dates. It even checks the whole chain of certificates. Kudos to Robust Perception for explaining it perfectly in their blogpost.
We set up some charts in Grafana for visual monitoring in some dashboards, and the integration with Prometheus was trivial. The query language used to define the charts is the same as in Prometheus, which simplified their creation a lot.
We also integrated Prometheus with Pagerduty and created a schedule of people on-call for the critical alerts. For those alerts that were not considered critical, we only sent an email.
How does Prometheus make things better for you?
We can’t compare Prometheus with our previous solution because we didn’t have one, but we can talk about what features of Prometheus are highlights for us:
- It has very few maintenance requirements.
- It’s efficient: one machine can handle monitoring the whole cluster.
- The community is friendly-both dev and users. Moreover, Brian’s blog is a very good resource.
- It has no third-party requirements; it’s just the server and the exporters. (No RabbitMQ or Redis needs to be maintained.)
- Deployment of Go applications is a breeze.
What do you think the future holds for ShuttleCloud and Prometheus?
We’re very happy with Prometheus, but new exporters are always welcome (Celery or Spark, for example).
One question that we face every time we add a new alarm is: how do we test that the alarm works as expected? It would be nice to have a way to inject fake metrics in order to raise an alarm, to test it.